Key Takeaways
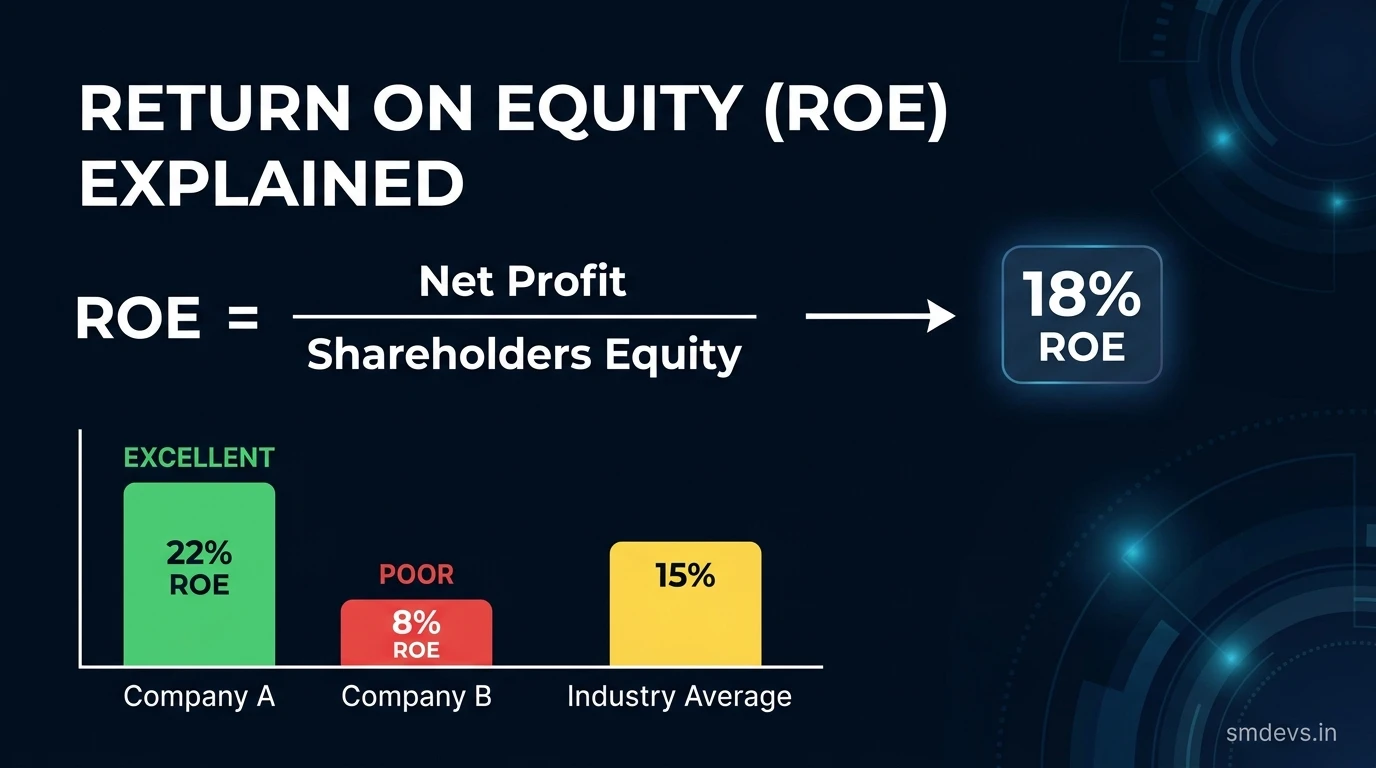
- ROE = Net Profit ÷ Shareholders Equity × 100 — measures profit generated per rupee of shareholder investment
- Consistently above 15–20% over 5 years signals a durable competitive advantage
- High debt can artificially inflate ROE — always check Debt/Equity ratio alongside ROE
- DuPont analysis breaks ROE into margin × turnover × leverage to identify quality vs. risky ROE
- Screen for ROE > 15% with Debt/Equity < 0.5 on Screener.in for quality stock ideas
Return on Equity (ROE) is one of the most powerful and widely used metrics in fundamental stock analysis. It measures how efficiently a company generates profits from the money shareholders have invested in it. Warren Buffett has cited ROE as one of his primary screening criteria for identifying exceptional businesses — and for good reason: consistently high ROE is one of the most reliable markers of a durable competitive advantage (economic moat).
What Is ROE?
ROE = Net Profit ÷ Shareholders' Equity × 100
In plain terms: for every ₹100 of shareholders' equity (the money investors have put in, retained as profit over the years), how much net profit did the company generate?
Example: A company has ₹500 crore in shareholders' equity and generates ₹100 crore in net profit.
ROE = 100 ÷ 500 × 100 = 20%
This means the company generated ₹20 of profit for every ₹100 of shareholder capital — a 20% return on equity.
Key Takeaways
- ROE above 15–20% consistently over 5+ years signals a competitive moat. Most ordinary businesses earn 8–12% ROE; exceptional businesses earn 20%+.
- Compare ROE to industry peers, not the broad market. A 12% ROE in banking may be excellent; 12% ROE in a capital-light software business is poor.
- High ROE can be distorted by high debt. Always check the Debt/Equity ratio alongside ROE — if a company is borrowing heavily to boost ROE, the quality of that ROE is questionable.
- ROE trend matters as much as the absolute number. Rising ROE over 5 years (from 12% to 20%) signals improving competitive position and management efficiency.
- Use ROCE (Return on Capital Employed) as a complement to ROE for capital-intensive businesses to get a fuller picture of capital efficiency.
Why High ROE Matters for Stock Selection
A business with consistently high ROE does something mathematically beautiful for long-term investors: it compounds wealth efficiently without requiring constant additional capital injection.
Consider two businesses, each starting with ₹100 crore equity:
- Business A (10% ROE): Earns ₹10 crore in year 1. If retained, equity grows to ₹110 crore. Earns ₹11 crore in year 2. After 10 years: ₹259 crore equity and ₹25.9 crore annual earnings.
- Business B (25% ROE): Earns ₹25 crore in year 1. If retained, equity grows to ₹125 crore. After 10 years: ₹931 crore equity and ₹232 crore annual earnings.
Starting from the same base, Business B generates nearly 9× more earnings after 10 years — purely due to higher ROE. This is exactly why Buffett pays premium prices for high-ROE, wide-moat businesses: the compounding effect of superior capital allocation creates disproportionate long-term value.
The DuPont Analysis — Breaking Down ROE
ROE can be decomposed into three component ratios using the DuPont formula, revealing the source of a company's ROE:
ROE = Net Profit Margin × Asset Turnover × Equity Multiplier
- Net Profit Margin (Net Profit ÷ Revenue): How much profit the company extracts from each rupee of revenue. High margins signal pricing power or cost efficiency.
- Asset Turnover (Revenue ÷ Total Assets): How efficiently the company uses its assets to generate revenue. High turnover is common in retail (low margins, high volume); low turnover in capital-intensive industries.
- Equity Multiplier (Total Assets ÷ Shareholders' Equity): The leverage factor. Higher multiplier = more debt. A company can inflate ROE artificially by taking on more debt.
Why this matters: Two companies with identical 20% ROE may be very different businesses:
- Company A: 20% margin, 1.0 turnover, 1.0 leverage → High-margin, no-debt business (excellent quality)
- Company B: 4% margin, 1.0 turnover, 5.0 leverage → Low-margin business with 5× debt (risky ROE)
What Is a Good ROE?
| ROE Range | Assessment | Common in |
|---|---|---|
| Below 8% | Poor — below cost of equity | Distressed businesses, commodity cycles |
| 8–12% | Average — mediocre capital allocation | PSU banks, capital-intensive industries |
| 12–18% | Good — above-average capital efficiency | Established large-caps, mature businesses |
| 18–25% | Excellent — signals competitive advantage | Quality FMCG, pharma, private banks |
| Above 25% | Exceptional — wide moat business | Technology leaders, premium brands |
Indian Companies Known for Consistently High ROE
As of the past 5-year average (not investment advice — verify current data):
- Asset-light businesses with strong brand moats: FMCG leaders, premium consumer companies
- Quality private sector banks with efficient capital allocation
- Technology and software companies with minimal capital requirements
- Healthcare and pharmaceutical companies with durable product pipelines
Screen for consistently high ROE (5-year average above 15%) on platforms like Screener.in by filtering for "Return on Equity 5Y > 15" and "Debt/Equity < 1."
ROE vs. ROCE vs. ROIC
| Metric | Formula | Best Used For | Limitation |
|---|---|---|---|
| ROE | Net Profit ÷ Equity | Shareholder return efficiency | Distorted by high debt |
| ROCE | EBIT ÷ Capital Employed | Capital-intensive businesses | Ignores tax and interest structure |
| ROIC | NOPAT ÷ Invested Capital | Most precise capital efficiency measure | Complex to calculate; data not always available |
For most retail investors analyzing Indian stocks: use ROE as your primary screen, ROCE as a secondary check for capital-intensive sectors (cement, steel, infrastructure), and Debt/Equity to verify the ROE isn't being artificially inflated by leverage.
Frequently Asked Questions
Can ROE be too high?
Yes — an unusually high ROE (above 40–50%) warrants scrutiny rather than automatic enthusiasm. It could indicate: extremely high leverage (borrowed capital inflating equity returns), very low shareholder equity base (common in asset-light service businesses where this is legitimate), share buybacks (reducing equity denominator), or aggressive accounting. Always run the DuPont decomposition when ROE seems unusually high — it will identify whether the source is operating efficiency (good) or financial leverage (risky).
What is a good ROE for Indian banks?
Banking is a leverage-intensive industry by nature — banks borrow deposits and lend them out, so high equity multipliers are structurally normal. For Indian private sector banks, ROE in the range of 14–20% is considered excellent. PSU (government-owned) banks typically have lower ROE due to NPAs, directed lending mandates, and less efficient capital allocation — ROE of 8–14% is typical for better-run PSU banks. Always compare bank ROE to direct peers, not to other sectors.
How does share buyback affect ROE?
Share buybacks reduce the equity denominator (shareholders' equity) because they use retained earnings to repurchase outstanding shares. This mathematically increases ROE even if operating profits remain unchanged — because the same profit is now divided by a smaller equity base. While buybacks are generally positive signals (management believes shares are undervalued), an ROE that is primarily driven by buybacks rather than operating efficiency is less "high quality" than ROE driven by genuine profit growth. Analyze the 5-year trend in both net profit growth and ROE to distinguish between the two sources.
What is the difference between ROE and return on investment (ROI)?
ROE measures returns generated specifically for equity shareholders — net profit relative to shareholders' equity. ROI is a broader term that can mean different things depending on context — it might measure returns on a specific project, marketing campaign, or investment relative to its total cost. In stock analysis, ROE is the standard metric for measuring management's efficiency in generating shareholder value. ROI is more commonly used in project evaluation, marketing analytics, and personal investment performance tracking.
Your Next Step
Screen for high-ROE stocks using the free Screener.in filter: ROE > 15%, 5-year, with Debt/Equity < 0.5. For the complete fundamental analysis framework, see the Fundamental Analysis guide. Combine ROE analysis with the P/E Ratio guide to assess whether a high-ROE stock is also reasonably valued before investing.


