Key Takeaways
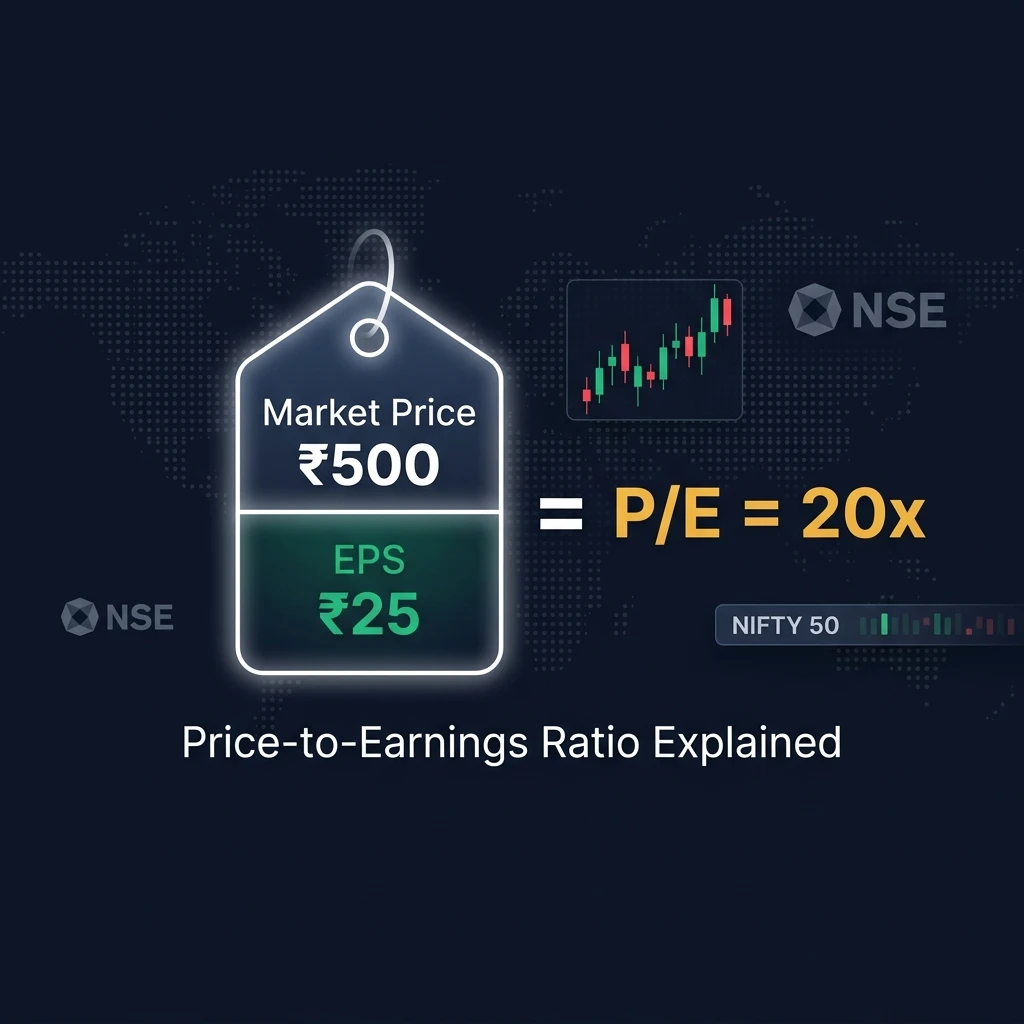
- The P/E ratio (Price-to-Earnings ratio) measures how much investors pay for every rupee of a company's earnings. Formula: P/E = Market Price per Share ÷ EPS.
- A high P/E means investors expect high growth; a low P/E may signal undervaluation or low growth expectations.
- Never use P/E in isolation — always compare it to the sector average, the company's historical range, and growth rate (PEG ratio).
- The Nifty 50's long-term average P/E is approximately 20–22x. Anything above 30x is historically expensive for the index.
- Use our free Intrinsic Value Calculator to combine P/E analysis with DCF and Graham formula valuation in seconds.
What Is the P/E Ratio?
The P/E ratio (Price-to-Earnings ratio) is the most widely used metric in stock valuation. It measures how much an investor is paying for every rupee (or dollar) of a company's annual earnings. The P/E ratio tells you whether a stock is expensive or cheap relative to its earnings power — but only when compared correctly to sector peers and historical ranges.
A P/E of 20 means investors are paying ₹20 for every ₹1 of annual profit. Whether that is expensive or cheap depends entirely on the company's growth rate, industry norms, and the overall market environment.
P/E Ratio Formula
The P/E ratio formula is:
P/E Ratio = Current Market Price per Share ÷ Earnings Per Share (EPS)Where:
- Current Market Price per Share — the live price of one share on the stock exchange
- Earnings Per Share (EPS) — the company's net profit divided by total outstanding shares
There are two variations of the P/E ratio that use different EPS values:
- Trailing P/E (TTM) — uses the last 12 months of actual reported earnings. More reliable because it uses real data.
- Forward P/E — uses analyst estimates of the next 12 months of earnings. More forward-looking but based on projections that may be wrong.
How to Calculate the P/E Ratio: Worked Example
Consider a fictional company listed on NSE:
- Current share price: ₹480
- Net profit last year: ₹120 crore
- Shares outstanding: 6 crore
EPS = Net Profit ÷ Shares Outstanding
EPS = ₹120 Cr ÷ 6 Cr = ₹20 per share

P/E Ratio = ₹480 ÷ ₹20 = 24x
Result: The stock trades at 24 times earnings. For every ₹1 of profit, investors pay ₹24. Whether this is reasonable depends on the sector and growth rate — which we will explore below.
What Is a Good P/E Ratio?
There is no universal "good" P/E ratio. Context is everything. The same P/E of 25 is cheap for a fast-growing consumer technology company and extremely expensive for a slow-growth public sector bank.
Nifty 50 Historical P/E Benchmarks
| Nifty 50 P/E Zone | Market Signal | Historical Frequency |
|---|---|---|
| Below 16x | Market is historically cheap — strong long-term buy zone | Rare (crisis periods only) |
| 16x – 22x | Fair value zone — reasonable entry for long-term investors | Most common range |
| 22x – 28x | Moderately expensive — be selective, require higher quality | Occasional bull markets |
| Above 28x | Historically expensive — elevated risk of correction | Rare (bubble periods) |
Sector P/E Benchmarks (India, approximate)
| Sector | Typical P/E Range | Why Higher/Lower |
|---|---|---|
| FMCG / Consumer Staples | 40x – 70x | Predictable earnings, high brand moats, slow decline in hard times |
| IT / Technology | 25x – 40x | High growth expectations, scalable business models |
| Pharmaceuticals | 20x – 35x | R&D driven, regulatory risk, moderate growth |
| Banking (Private) | 15x – 25x | Cyclical, capital intensive, regulated returns |
| PSU Banking | 6x – 12x | Government ownership, slower growth, NPA risks |
| Metals / Commodities | 5x – 15x | Highly cyclical earnings — P/E spikes at cycle lows |
| Real Estate | 25x – 60x | Cash flow timing distorts earnings; often valued on NAV |
Key rule: Always compare a company's P/E to its own sector average — never to the overall market. A bank with a P/E of 35x is extremely expensive. An FMCG company at 35x is below average.
P/E Ratio vs PEG Ratio: The Growth Adjustment
The P/E ratio's biggest weakness is that it ignores growth. A company growing earnings at 30% per year deserves a much higher P/E than one growing at 5%. The PEG Ratio fixes this by dividing P/E by the earnings growth rate:
PEG Ratio = P/E Ratio ÷ Earnings Growth Rate (%)

Example: P/E of 30, earnings growth of 25%/year
PEG = 30 ÷ 25 = 1.2
PEG interpretation:
- PEG below 1.0 — the stock may be undervalued relative to its growth rate
- PEG of 1.0 — fairly valued (Peter Lynch's benchmark for "fairly priced")
- PEG above 2.0 — typically expensive unless the growth is extremely reliable
The PEG ratio was popularized by legendary fund manager Peter Lynch, who considered it a more complete valuation shorthand than P/E alone.
Limitations of the P/E Ratio
Understanding what P/E cannot tell you is as important as knowing how to calculate it:
1. P/E Breaks Down for Loss-Making Companies
If a company reports a net loss (negative EPS), the P/E ratio is negative or undefined — completely meaningless. New-age tech companies, startups, and turnaround situations cannot be valued with P/E. Use Price-to-Sales (P/S) or EV/EBITDA for these.
2. Earnings Can Be Manipulated
The "E" in P/E is accounting net profit, which can be distorted by one-time exceptional income or expenses, depreciation policy changes, deferred tax adjustments, and goodwill write-offs. Always check if current EPS is representative of the company's normalized earning power before using it in valuation.
3. P/E Ignores the Balance Sheet
A company with ₹10,000 crore in debt and a P/E of 15 is far less attractive than a debt-free company with the same P/E. The P/E ratio says nothing about financial leverage, cash reserves, or off-balance-sheet risks. Use EV/EBITDA (Enterprise Value to EBITDA) for a debt-adjusted comparison.
4. Cyclical Companies Have Inverted P/E Signals
For highly cyclical businesses like steel, cement, and shipping, P/E ratios are paradoxically low at the peak of the cycle (when earnings are at their best and everyone is optimistic) and high at the trough (when earnings collapse but the stock has already fallen significantly). Buying cyclicals at low P/E often means buying at the peak.
How to Use P/E Ratio Correctly: 3-Step Framework
- Compare to sector peers — Is the company's P/E above or below its industry median? A 20% premium to the sector average needs justification (higher growth, better margins, stronger brand).
- Compare to historical range — Is the company trading at the high or low end of its own 5-year P/E band? Buying near the lower end of the historical range reduces valuation risk.
- Adjust for growth with PEG — Divide by the expected earnings growth rate. A high P/E with an even higher growth rate may still represent fair value.
For a comprehensive stock valuation, combine P/E analysis with DCF modelling using our free Intrinsic Value Calculator. It computes fair value using both the DCF model and Benjamin Graham's formula, giving you a more complete picture than P/E alone.
Trailing P/E vs Forward P/E: Which to Use?
| Trailing P/E (TTM) | Forward P/E | |
|---|---|---|
| Based on | Last 12 months actual earnings | Next 12 months estimated earnings |
| Reliability | High — uses real reported data | Lower — analysts can be wrong |
| Best for | Conservative comparison, historic analysis | High-growth companies where past understates future |
| Risk | May overstate P/E if recent earnings were weak | Estimates often too optimistic; can flatter valuation |
For most situations, the trailing P/E is more reliable because it uses actual reported numbers. Forward P/E is useful for companies in high-growth phases where current earnings significantly understate future earning power.
What is the P/E ratio in simple terms?
The P/E ratio (Price-to-Earnings ratio) measures how much you pay for every rupee of a company's annual profit. If a stock has a P/E of 20, you are paying ₹20 for every ₹1 of yearly earnings. It is calculated by dividing the current share price by the earnings per share (EPS). A higher P/E generally means investors expect higher future growth; a lower P/E may indicate a value stock or a company in a slow-growth sector.
What is a good P/E ratio for Indian stocks?
There is no single "good" P/E ratio for Indian stocks — it depends on the sector. For the Nifty 50 index, a P/E between 16x and 22x is historically fair value; above 28x is expensive. For FMCG stocks, a P/E of 40–60x is normal. For PSU banks, 6–12x is the typical range. Always compare a stock's P/E to its own sector peers and its historical 5-year average range — never to the overall market index P/E.
What does a high P/E ratio mean?
A high P/E ratio means investors are paying a premium for each rupee of earnings, usually because they expect the company to grow its profits rapidly in the future. Growth stocks like fast-expanding technology or consumer companies typically carry high P/E ratios. However, a high P/E can also indicate overvaluation — where the market has priced in too much optimism that may not materialise. Always pair a high P/E reading with the PEG ratio (P/E divided by growth rate) to assess whether the premium is justified by actual growth expectations.
What is the difference between P/E ratio and EPS?
EPS (Earnings Per Share) is the company's net profit divided by total shares outstanding — it measures how much profit the company makes per share. The P/E ratio is the current share price divided by EPS — it measures what price investors are paying per unit of that profit. EPS tells you what the company earns; P/E tells you what the market values those earnings at. Both are used together for valuation: if EPS is growing and P/E remains stable, the share price should rise proportionally.
Is a low P/E ratio always better for investing?
No — a low P/E ratio is not always a buy signal. It can mean a company is undervalued (a genuine opportunity), or it can mean investors are pricing in low future growth, declining earnings, industry disruption, or high business risk. This is called a "value trap." For cyclical industries like metals and commodities, a very low P/E often occurs at the peak of the earnings cycle — precisely the worst time to buy. Always examine why the P/E is low before concluding a stock is cheap.


