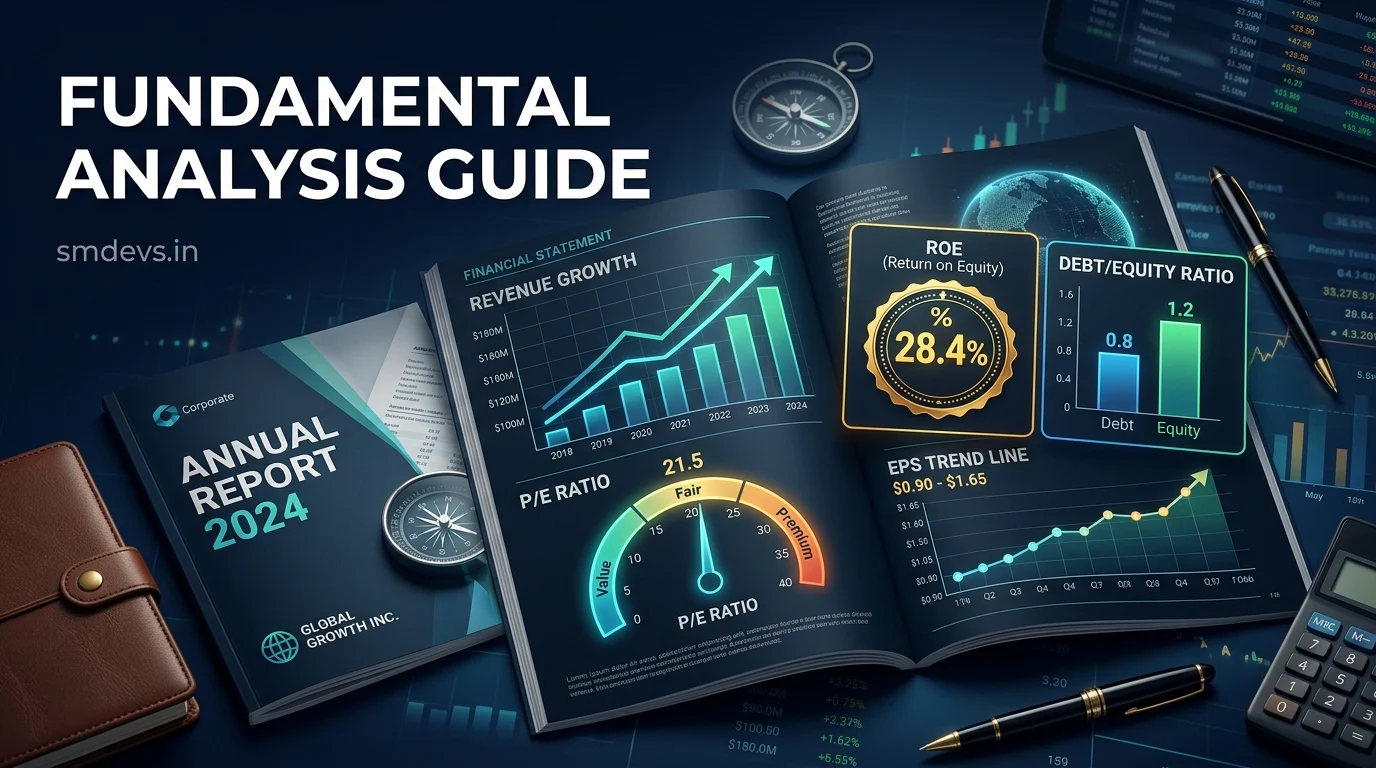
Key Takeaways
- Fundamental analysis = evaluating a company's intrinsic value through financials and business quality
- The 4 statements that matter: Income Statement, Balance Sheet, Cash Flow Statement, Annual Report
- Free Cash Flow (FCF) is the most important indicator — cannot be easily manipulated like accounting profits
- ROE above 15% consistently over 5 years signals a durable competitive advantage
- Always check Promoter Holding — declining promoter stake is a red flag in Indian markets
Fundamental analysis is the process of evaluating a company's intrinsic value by examining its financial statements, business model, competitive position, management quality, and macroeconomic environment. Unlike technical analysis — which studies price charts — fundamental analysis asks a fundamentally different question: what is this business actually worth, and is the current stock price higher or lower than that value?
Warren Buffett, Peter Lynch, and Benjamin Graham — three of the greatest investors in history — are all fundamental analysis practitioners. The approach has produced extraordinary long-term returns precisely because it grounds investment decisions in business reality rather than price speculation.
The Two Schools of Fundamental Analysis
Top-Down Analysis: Start with the macroeconomic environment (GDP growth, interest rates, inflation, government policy), then narrow to the sector most likely to benefit from those conditions, then identify the best companies within that sector. Useful for allocating capital across sectors based on economic cycle positioning.
Bottom-Up Analysis: Start directly with individual companies regardless of the macro environment — finding excellent businesses at reasonable prices no matter what sector or economic cycle they're in. Warren Buffett's preferred approach: "I don't buy sectors, I buy businesses."
Key Takeaways
- Fundamental analysis focuses on intrinsic value vs. market price. Buy when the market price is significantly below intrinsic value (margin of safety); avoid when market price is above intrinsic value.
- Revenue growth, profit margins, and return on equity are the three most important financial metrics for growth stocks.
- Debt levels are critical. A business with unsustainable debt can destroy even exceptional operations during downturns.
- Management quality matters as much as financial metrics. Excellent management can turn around struggling businesses; poor management can destroy profitable ones.
- Fundamental analysis is most powerful over longer time horizons. Short-term price movements are driven by sentiment; intrinsic value plays out over years.
The Four Financial Statements Every Investor Must Read
1. Income Statement (Profit & Loss Statement)
Shows revenue, costs, and profits over a specific period. Key lines to examine:
- Revenue (Top Line): Total sales. Is it growing consistently? What is the compound annual growth rate (CAGR) over 5 years?
- Gross Profit & Gross Margin: Revenue minus Cost of Goods Sold. High and stable gross margins indicate pricing power and competitive moats.
- Operating Profit (EBIT) & Operating Margin: Profitability after operating costs. Expanding operating margins over time indicate improving efficiency.
- Net Profit (Bottom Line) & Net Margin: Final profit after all expenses and taxes. Growing net profit with expanding net margins is the ideal combination.
- EPS (Earnings Per Share): Net Profit ÷ Number of Shares. Dilution (share count increasing without proportional profit growth) is a red flag. See the EPS guide.
2. Balance Sheet
A snapshot of what the company owns (assets) and owes (liabilities) at a specific date. The equation: Assets = Liabilities + Shareholders' Equity.
Key metrics from the balance sheet:
- Debt-to-Equity Ratio: Total Debt ÷ Shareholders' Equity. Higher ratios indicate more financial risk. Generally, D/E below 1.0 is conservative; above 2.0 requires scrutiny. Compare to industry peers.
- Current Ratio: Current Assets ÷ Current Liabilities. A ratio above 1.5–2.0 indicates the company can comfortably meet short-term obligations.
- Cash and Cash Equivalents: A strong cash position provides financial flexibility for acquisitions, downturns, and R&D without needing external financing.
- Return on Equity (ROE): Net Profit ÷ Shareholders' Equity. Measures how efficiently management uses shareholder capital to generate profits. ROE consistently above 15–20% in a competitive industry signals a durable competitive advantage.
3. Cash Flow Statement
Many investors consider this the most important of the three statements because cash flow cannot be manipulated as easily as accounting profits. Key section:
- Operating Cash Flow (OCF): Cash generated from core business operations. Must be positive and growing for a fundamentally healthy business. A company reporting net profits but generating negative OCF is a red flag — accounting is masking cash consumption.
- Free Cash Flow (FCF): Operating Cash Flow minus Capital Expenditures. The cash a business generates that's truly "free" — available for dividends, buybacks, acquisitions, or debt repayment. FCF is what Warren Buffett calls "owner earnings."
- FCF Yield: FCF per share ÷ Stock Price. A useful valuation metric — higher FCF yields suggest undervaluation relative to cash generation.
4. Annual Report and Notes
Beyond the financial statements themselves, the annual report's management discussion, shareholder letter, and footnotes often contain the most important qualitative information: explanations of business changes, related-party transactions, accounting policy changes, litigation risks, and management's own forward-looking assessment. Never skip the annual report when doing serious fundamental research.
Key Valuation Metrics
| Metric | Formula | What a "Good" Value Looks Like |
|---|---|---|
| P/E Ratio | Price ÷ EPS | Context-dependent; compare to industry average and historical range. High-growth companies command higher P/E. |
| PEG Ratio | P/E ÷ EPS Growth Rate (%) | Below 1.0 often considered undervalued relative to growth. PEG < 0.5 is potentially significantly undervalued. |
| P/B Ratio | Price ÷ Book Value per Share | Below 1.0 means trading below book value — potential deep value. Above 5× requires strong ROE justification. |
| EV/EBITDA | Enterprise Value ÷ EBITDA | Below 10× often considered reasonable for most industries. More useful than P/E for comparing capital-structure differences. |
| ROE | Net Profit ÷ Equity | Above 15% consistently over 5+ years indicates durable competitive advantage. |
| ROCE | EBIT ÷ Capital Employed | Above 20% consistently. Better than ROE for capital-intensive businesses. |
| Debt/Equity | Total Debt ÷ Equity | Below 0.5 is conservatively financed. Above 2.0 requires scrutiny of cash flow adequacy. |
Qualitative Factors — The Other Half of Fundamental Analysis
Numbers alone never tell the full story. Experienced fundamental analysts spend as much time on qualitative factors as quantitative ones:
- Economic Moat: Does the company have durable competitive advantages — brand, network effects, switching costs, cost advantages, or regulatory protection — that protect its profits from competition?
- Management Quality: Does management have a track record of capital allocation excellence? Are they honest in shareholder communications? Do they own significant shares alongside investors?
- Industry Tailwinds: Is the industry growing, stable, or declining? Is the company in a position to gain market share within its industry?
- Business Model Durability: Can this business survive a recession, technological disruption, or regulatory change?
- Promoter Holding: In Indian markets, high and stable promoter holding (above 50%) generally signals alignment between management and shareholders. Declining promoter holding is a red flag.
Frequently Asked Questions
How is fundamental analysis different from technical analysis?
Fundamental analysis evaluates what a company is worth (intrinsic value) by studying its financials, business model, and competitive position. It answers: "Is this stock cheap or expensive?" Technical analysis studies price and volume charts to predict future price movements. It answers: "Where is the price going next?" Many investors use both: fundamental analysis to select which stocks to buy (the what), and technical analysis to time their entry and exit points (the when).
What P/E ratio is considered good for Indian stocks?
There is no universal "good" P/E ratio — it depends entirely on the sector, growth rate, and current market conditions. The Nifty 50 historically trades at 18–25× earnings. Individual stocks with exceptional growth (20%+ EPS CAGR) may reasonably trade at 40–60× earnings. Conversely, mature businesses with low growth should trade at much lower multiples (8–15×). Always compare a stock's P/E to its own historical range and to direct industry peers — not to the broad market. The PEG ratio (P/E ÷ growth rate) is often more useful than P/E alone for growth stock valuation.
How do I find free financial data for Indian stocks?
Key free resources for Indian stock fundamental data: Screener.in (most popular — comprehensive financial statements, ratios, and 10-year trends for NSE/BSE listed companies), Moneycontrol (annual reports, financials, shareholding data), BSE India and NSE India (official regulatory filings and annual reports), Trendlyne (quantitative screening and alerts), and each company's Investor Relations page on their official website (primary source for latest results and annual reports).
What are red flags in fundamental analysis?
Key red flags to screen for: consistently negative or declining free cash flow despite positive reported earnings (accounting may be masking problems); rapidly rising debt without corresponding revenue growth; declining promoter holding over multiple quarters; revenue growing but margins consistently compressing (pricing power issues); very high receivables relative to revenue (customers not paying — potential revenue recognition problems); frequent "exceptional items" in the P&L that seem to recur every year (one-time charges that are never truly one-time); and management that frequently misses their own forward guidance.
Your Next Step
Start your fundamental analysis practice on Screener.in — filter for companies with ROE above 15%, Debt/Equity below 0.5, and 5-year revenue CAGR above 15%. For the valuation fundamentals, see the P/E Ratio guide and the Intrinsic Value Calculator guide. Build your risk management framework with the Trading Risk Management infographic.


