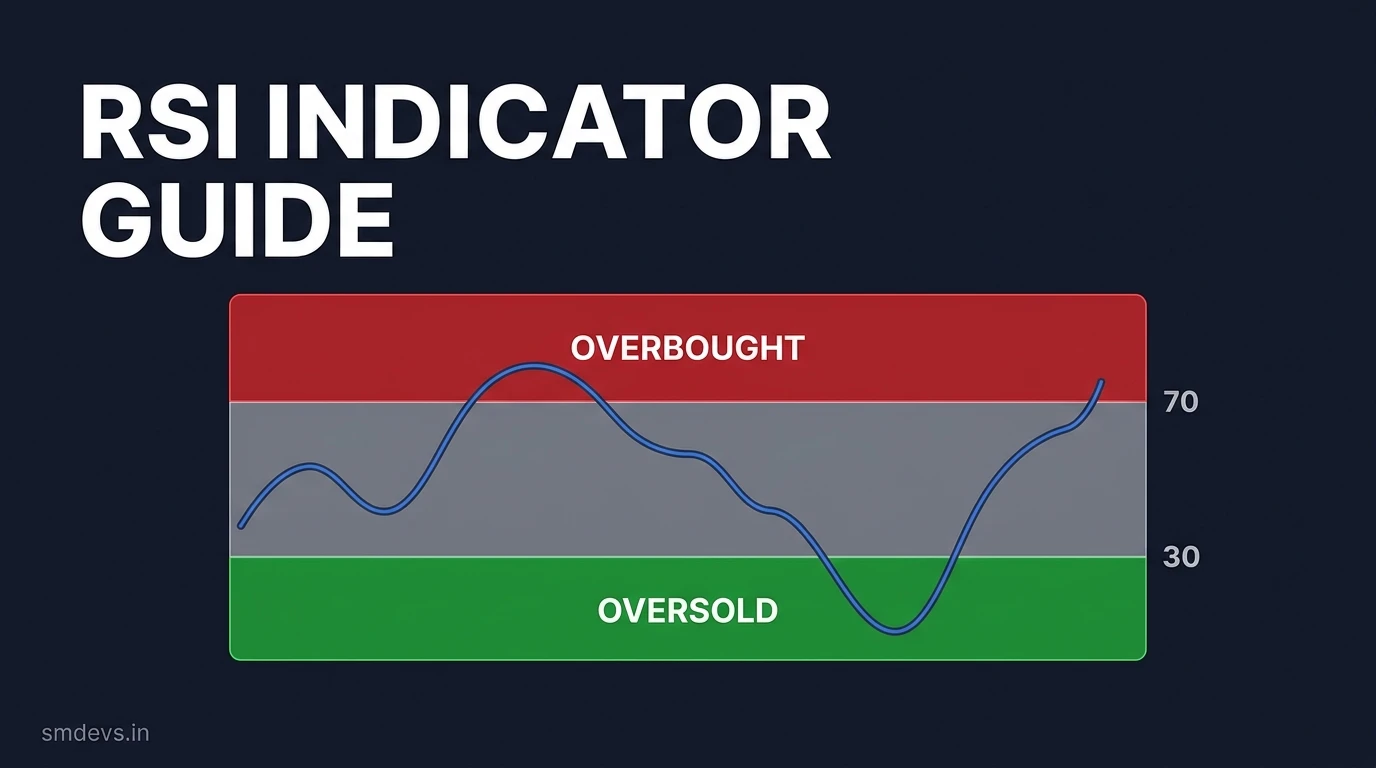
Key Takeaways
- RSI > 70 = overbought — wait for crossback BELOW 70 before selling, not the initial touch
- RSI < 30 = oversold — wait for crossback ABOVE 30 before buying, not the initial touch
- Bullish divergence: price lower low, RSI higher low = hidden buying pressure, potential reversal up
- Bearish divergence: price higher high, RSI lower high = weakening momentum, potential reversal down
- Default 14-period RSI works for most traders; shorter periods for faster charts, longer for position trading
The Relative Strength Index (RSI) is the most widely used momentum oscillator in technical analysis. Created by J. Welles Wilder Jr. in 1978 and introduced in his book New Concepts in Technical Trading Systems, RSI has remained a cornerstone indicator for traders across every asset class — stocks, forex, crypto, and commodities. Yet despite its popularity, the majority of traders misuse it by treating every overbought or oversold reading as an automatic trade signal.
This guide teaches you how to read RSI correctly, avoid the most common mistakes, and use all three of its primary signals — overbought/oversold zones, zero-line crossovers, and divergence — to make better trading decisions.
What Is the RSI Indicator?
RSI is a momentum oscillator that measures the speed and magnitude of recent price changes on a scale from 0 to 100. It compares the average size of recent gains to the average size of recent losses over a defined lookback period (default: 14 periods).
The RSI formula is: RSI = 100 − (100 ÷ (1 + RS)), where RS = Average Gain ÷ Average Loss over the lookback period.
In practical terms:
- When price rises strongly and consistently, RSI moves toward 100 — indicating strong bullish momentum.
- When price falls strongly and consistently, RSI moves toward 0 — indicating strong bearish momentum.
- When price is relatively flat or mixed, RSI hovers near 50 — indicating no clear momentum bias.
Key Takeaways
- RSI above 70 does not automatically mean sell. In strong uptrends, RSI can stay overbought for weeks. Wait for RSI to drop back below 70 before acting.
- RSI below 30 does not automatically mean buy. In strong downtrends, RSI can stay oversold for extended periods. Wait for RSI to rise back above 30 before entering.
- Divergence is RSI's most powerful signal — and it leads price reversals, making it a leading indicator within an otherwise lagging tool.
- The 14-period default works well for most traders. Shorter periods (7–9) make RSI more sensitive; longer periods (21–25) smooth it out for position traders.
- RSI at 50 is directionally neutral — the 50 level is often used as a trend filter: above 50 favours longs, below 50 favours shorts.
The Three RSI Zones Explained
Overbought Zone (RSI > 70)
When RSI rises above 70, an asset is considered overbought — meaning buying momentum has been strong enough to push the indicator into elevated territory. This does not mean the price will immediately reverse. In strong bull markets, RSI can remain above 70 for weeks or even months.
The correct way to use the overbought signal: Wait for RSI to cross back below 70 (not just reach 70) before considering a short or exit. This crossback-below-70 signal is the actual trigger, not the initial rise above 70.
Context matters: An overbought RSI reading at a key resistance level is far more actionable than the same reading in an area with no technical significance. Combine overbought RSI with resistance levels, bearish candlestick patterns, or volume analysis for confirmation.
Oversold Zone (RSI < 30)
When RSI falls below 30, an asset is considered oversold — selling momentum has been dominant. Again, this alone is not a buy signal. During sustained downtrends, RSI can remain below 30 for extended periods as the asset continues falling.
The correct trigger: Wait for RSI to cross back above 30 before considering a long entry. This cross back above 30 confirms that selling momentum is genuinely easing.
Most reliable setup: RSI drops below 30 (establishes the oversold condition), then bounces back above 30 while price is sitting on a major support level, accompanied by a bullish reversal candlestick (hammer, bullish engulfing). This triple alignment dramatically improves the probability of a successful long trade.
Neutral Zone (RSI 30–70)
Most of the time, RSI sits in the neutral zone between 30 and 70. This area still provides useful information:
- RSI crossing above 50 in an uptrend confirms the trend is resuming after a pullback — a potential low-risk entry point.
- RSI crossing below 50 in a downtrend confirms the downtrend is resuming after a bounce.
- RSI repeatedly failing to cross above 50 in a downtrend signals persistent bearish momentum — stay short or stay out.
RSI Divergence — The Most Powerful Signal
Divergence is where RSI becomes a truly leading indicator — warning of potential reversals before they appear on the price chart. It occurs when the price chart and RSI tell contradictory stories.
Bullish Divergence
Price makes a lower low (the price is still falling), but RSI makes a higher low (momentum is improving). This means that although price appears to be continuing its decline, the underlying selling momentum is weakening. Hidden buying pressure is building.
How to identify it: Draw a line connecting two recent price lows on the chart. Draw a corresponding line connecting the two equivalent RSI lows. If the price line slopes down but the RSI line slopes up — you have bullish divergence.
Trading it: Do not enter on divergence alone. Wait for a confirming trigger — RSI crossing back above 30, a bullish engulfing pattern, or a break above a recent resistance level. Place your stop below the most recent price low.
Bearish Divergence
Price makes a higher high (still rising), but RSI makes a lower high (momentum is weakening). The rally is losing internal strength even as price continues to push higher. This often precedes a significant reversal.
How to identify it: Draw a line connecting two recent price highs. Draw a corresponding line connecting the RSI highs at those points. If the price line slopes up but the RSI line slopes down — you have bearish divergence.
Trading it: Look for confirmation at a key resistance level. A bearish divergence occurring as price tests a major resistance zone, combined with a reversal candle (shooting star, bearish engulfing), is one of the highest-probability short setups in technical analysis.
RSI Settings — Choosing the Right Period
| Trading Style | RSI Period | Sensitivity | Best For |
|---|---|---|---|
| Scalping (1m–5m) | 7–9 | High | Quick overbought/oversold signals on fast charts |
| Day Trading (15m–1H) | 14 | Medium | Standard intraday momentum analysis |
| Swing Trading (4H–Daily) | 14 | Medium | Best balance of signal frequency and reliability |
| Position Trading (Weekly) | 21–25 | Low | Smooth, high-conviction macro trend signals |
Common RSI Mistakes That Cost Traders Money
- Shorting the moment RSI hits 70. RSI can stay above 70 for the entire duration of a bull run. Entering shorts prematurely in trending markets is one of the most common causes of losses for RSI-dependent traders.
- Using RSI in isolation. RSI is most powerful when combined with support/resistance levels, trend analysis, and volume. A standalone RSI signal has approximately 55–60% reliability; combined with price action confirmation, this rises significantly.
- Ignoring the trend context. In a strong uptrend on the daily chart, RSI overbought signals on the 4H chart frequently fail. Always check the higher-timeframe trend before trading shorter-timeframe RSI signals.
- Missing divergence setups. Many traders obsessively watch the 70/30 levels but completely ignore divergence — which is statistically the more reliable of the two signal types.
- Changing the RSI period constantly. Pick a period for your trading style and use it consistently. Over-optimizing RSI settings for specific historical data creates "curve-fitting" that fails in live markets.
RSI vs. Stochastic — Which Is Better?
Both RSI and Stochastic are momentum oscillators, but they behave differently:
- RSI measures the speed of price changes. It is smoother, less prone to whipsaws, and better suited for trending markets.
- Stochastic measures where price closed within its recent range. It oscillates faster, provides more signals, and is better suited for range-bound markets.
For most swing traders on daily charts, RSI is the preferred choice. For range-bound, oscillating markets (such as certain sideways forex pairs or during low-volatility periods), Stochastic can provide cleaner signals.
Frequently Asked Questions
What does an RSI of 50 mean?
An RSI reading of exactly 50 means that average gains and average losses over the lookback period are equal — no net momentum in either direction. In practical trading, RSI above 50 is treated as a bullish momentum signal (favour longs) and RSI below 50 as a bearish momentum signal (favour shorts). Many trend traders use the RSI 50 level as a "trend filter" — only taking long trades when RSI is above 50 and only taking short trades when it is below 50.
How reliable is RSI divergence?
RSI divergence is considered one of the more reliable signal types in technical analysis, but it still requires confirmation before acting. Studies and backtests suggest that bullish and bearish divergence, when confirmed by a price action trigger at a key level, produce directionally correct signals roughly 65–70% of the time — significantly above random chance. The key failure mode is acting on divergence without confirmation, or trading divergence against a very strong macro trend.
Can I use RSI on crypto?
Yes, RSI works on crypto assets. However, because crypto markets are significantly more volatile than traditional markets, you may find that the standard 70/30 thresholds generate too many false signals during extended bull runs or crashes. Many crypto traders use adjusted thresholds of 80/20 instead of 70/30, or rely primarily on RSI divergence rather than overbought/oversold readings.
What is hidden divergence?
Hidden divergence is the opposite of regular divergence and signals trend continuation rather than reversal. Bullish hidden divergence: price makes a higher low (uptrend intact) but RSI makes a lower low — a signal that the uptrend will resume. Bearish hidden divergence: price makes a lower high (downtrend intact) but RSI makes a higher high — a signal that the downtrend will resume. Hidden divergence is an advanced concept best used by experienced traders.
Should I combine RSI with MACD?
Combining RSI and MACD is a popular and effective approach. Use RSI to identify overbought/oversold conditions and divergence signals, and use MACD to confirm the direction and strength of momentum. When both indicators align — RSI showing a bullish divergence while MACD shows a bullish crossover — the signal confidence is significantly higher than either indicator alone. See the MACD Indicator Guide for complete MACD details.
Your Next Step
Download the free RSI Indicator Guide infographic for a quick-reference visual you can keep open during your trading sessions. For the full momentum indicator stack, pair it with the MACD Indicator Guide and the 5 Golden Rules of Trading Risk Management.


