RSI Indicator Guide — Overbought, Oversold & Divergence Explained
How to read the RSI indicator, identify overbought and oversold zones, spot bullish and bearish divergence, and trade all three signals correctly.
Click to open full-screen view · Free to share with attribution
About This Infographic
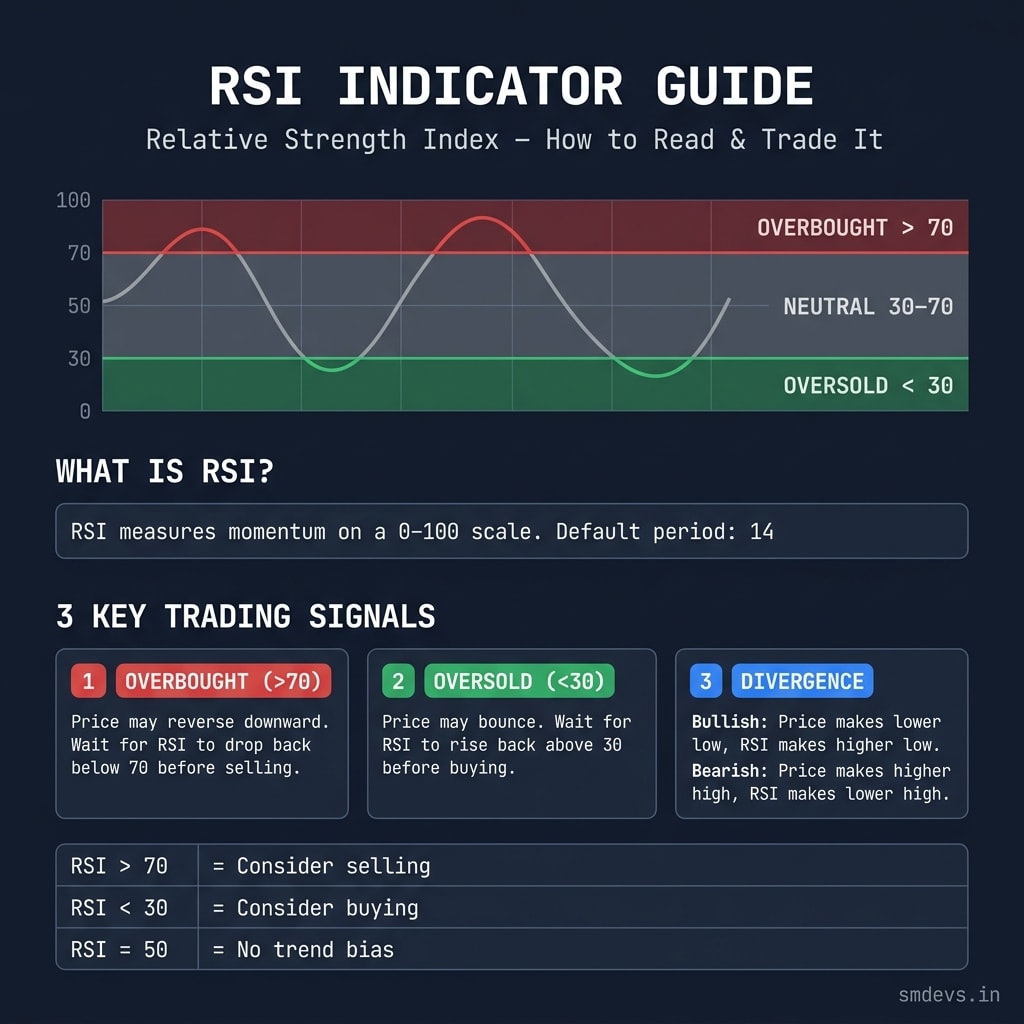
The Relative Strength Index (RSI) is one of the most widely used momentum oscillators in technical analysis — yet most traders misuse it by treating every overbought or oversold reading as an automatic buy or sell signal. This infographic breaks down the RSI into three actionable trading signals. The Overbought signal (RSI > 70) warns that buying momentum is exhausted and a reversal may be near — but the key is waiting for RSI to cross back below 70, not shorting into strength. The Oversold signal (RSI < 30) identifies potential bounce zones — wait for RSI to cross back above 30 before entering long. Divergence is the most powerful signal: Bullish Divergence occurs when price makes a lower low but RSI makes a higher low, indicating hidden buying pressure; Bearish Divergence occurs when price makes a higher high but RSI makes a lower high, warning of weakening momentum. A quick-reference table at the bottom maps RSI levels (>70, <30, =50) to directional bias. Default period is 14 on all timeframes.
Related Infographics

5 Golden Rules of Trading Risk Management
The 5 non-negotiable rules every trader must follow to protect capital and stay in the game long-term.
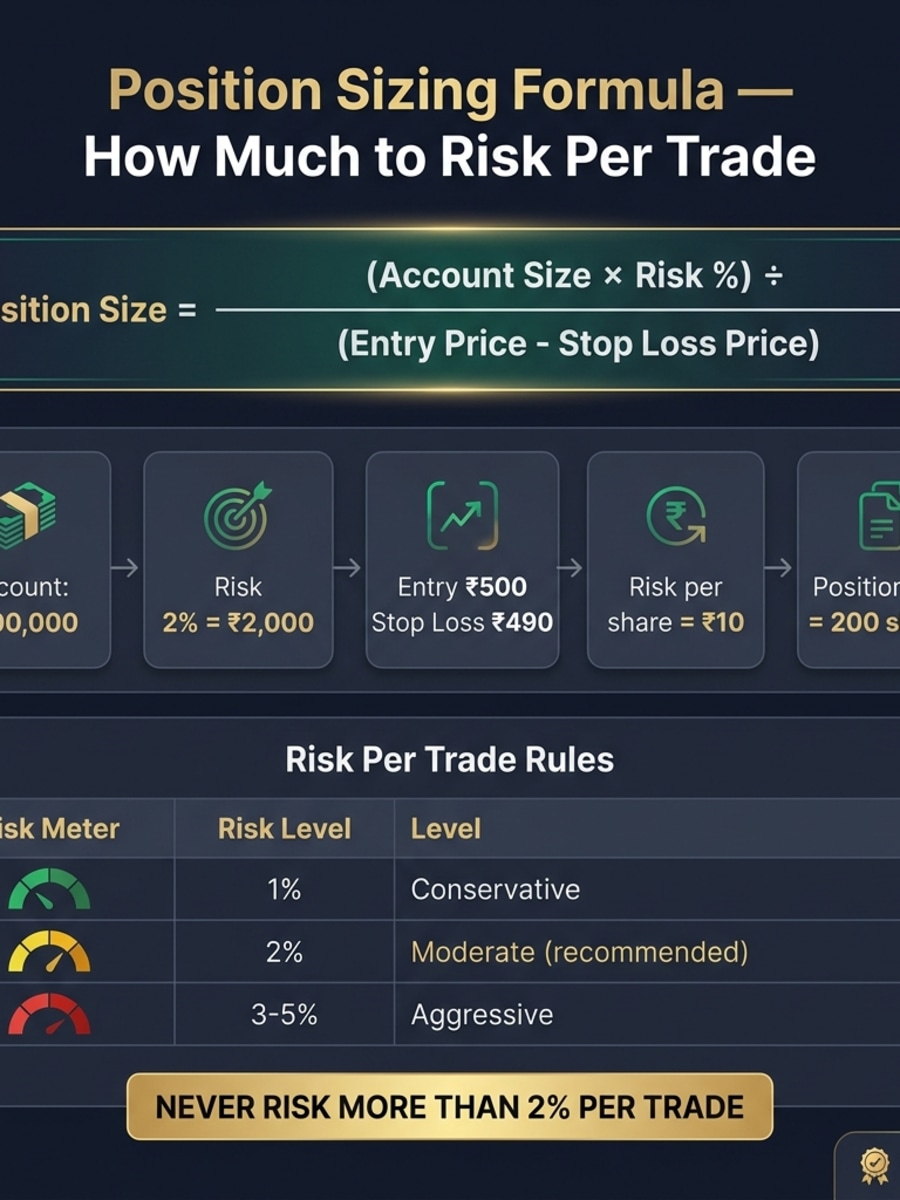
Position Sizing Formula — How Much to Risk Per Trade
The exact formula and worked example for calculating the perfect position size on every trade — no guesswork, no over-leveraging.
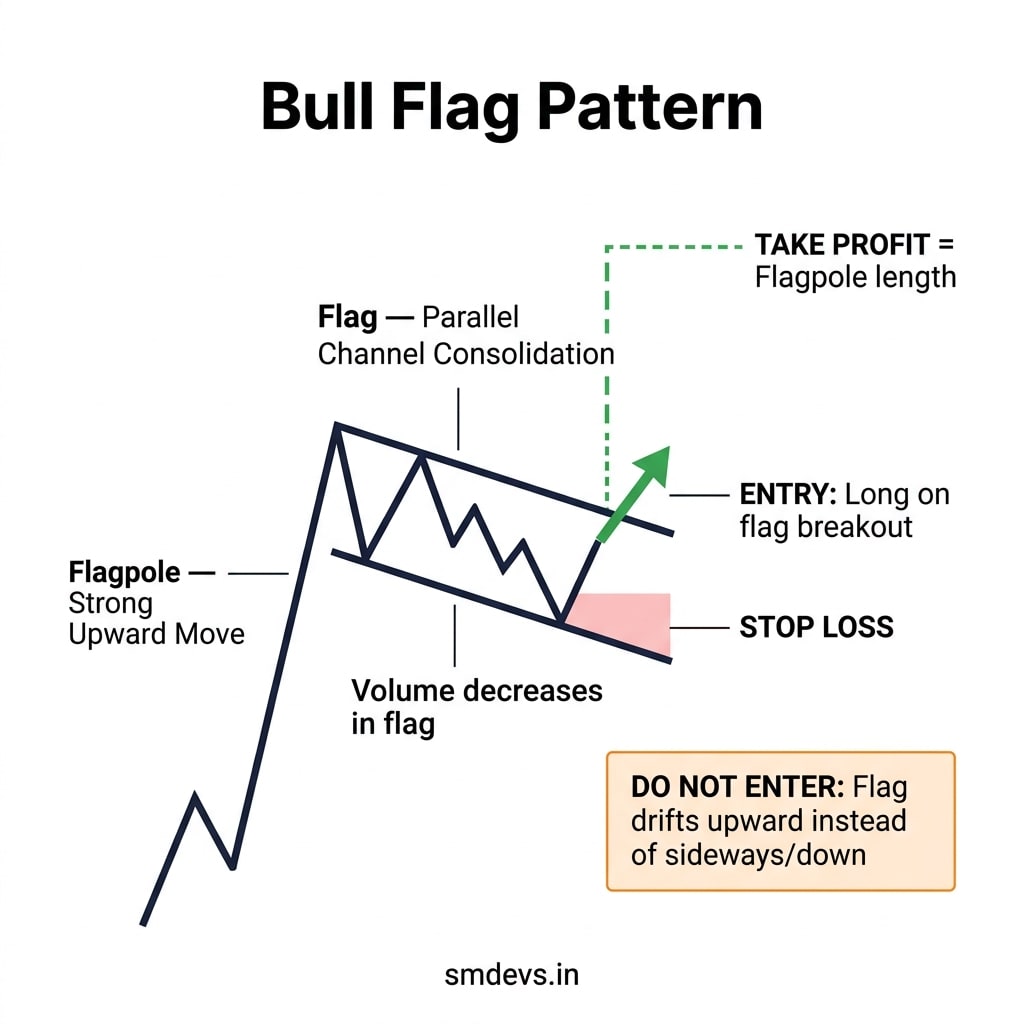
Bull Flag Pattern — Entry, Exit & Stop Loss Guide
How to identify a Bull Flag, when to enter on the breakout, where to set your stop loss, and what makes a bull flag invalid.
Need Help Growing Your Website?
Use our free SEO tools to audit and optimize your site — no signup required.