Key Takeaways
- MACD combines trend-following and momentum in one oscillator
- Bullish crossover: MACD line crosses above Signal line — potential buy
- Bearish crossover: MACD line crosses below Signal line — potential sell
- Divergence is the most powerful MACD signal — learn to spot it
- Use MACD on daily chart first, then 4H/1H for entry timing
The MACD indicator — Moving Average Convergence Divergence — is one of the most versatile tools in a trader's arsenal. Developed by Gerald Appel in the late 1970s, it combines trend-following with momentum analysis in a single oscillator. Understanding how to read and trade it correctly separates consistently profitable traders from those who get repeatedly stopped out.
This guide covers everything you need to know: what MACD is, how each component is calculated, the three core trading signals, and the common mistakes that cause traders to lose money using it.
What Is the MACD Indicator?
MACD is a momentum oscillator that measures the relationship between two Exponential Moving Averages (EMAs) of price. Unlike a simple moving average, an EMA gives more weight to recent price data, making it more responsive to new information.
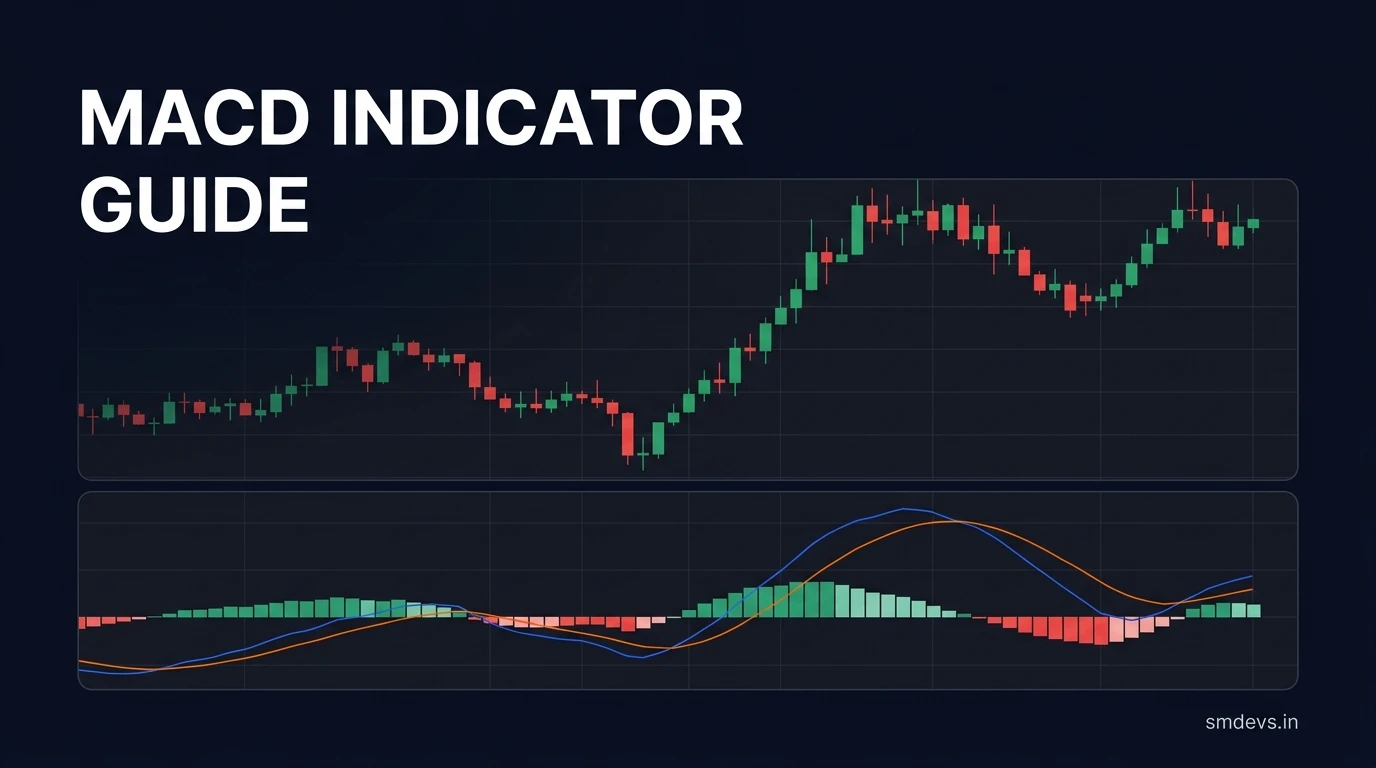
The indicator consists of three components:
- MACD Line: The difference between the 12-period EMA and the 26-period EMA. When the 12 EMA is above the 26 EMA, the MACD line is positive — indicating bullish momentum. When it falls below, it turns negative.
- Signal Line: A 9-period EMA of the MACD Line itself. This smooths out the MACD line and acts as a trigger for buy and sell signals.
- Histogram: The visual representation of the distance between the MACD Line and the Signal Line. Green bars above zero mean the MACD is above its signal (bullish momentum). Red bars below zero mean the MACD is below its signal (bearish momentum). As the bars grow taller, momentum is strengthening; as they shrink, momentum is fading.
Key Takeaways
- MACD measures momentum, not just direction. The histogram tells you whether momentum is accelerating or decelerating — critical for timing entries.
- The zero line matters. Crossovers that occur near or at the zero line carry more weight than those that happen far from it.
- Divergence is the most powerful — and most overlooked — MACD signal.
- Use MACD with the trend, not against it. On a downtrending stock, only trade bearish MACD signals. On an uptrending stock, only trade bullish signals.
- The daily chart is your primary MACD timeframe. Use 4H/1H for entry precision after daily confirms direction.
Signal 1 — Bullish Crossover
A bullish crossover occurs when the MACD Line crosses above the Signal Line. This tells you that short-term momentum is accelerating faster than the medium-term average — a potential buy signal.
How to trade it:
- Look for the crossover to happen below the zero line for the highest-probability setups. A crossover near zero is weaker; a crossover from deep negative territory followed by a surge above zero is the strongest version of this signal.
- Confirm with volume: a bullish crossover accompanied by rising volume is more reliable than one on low volume.
- The histogram turning from red to green is the early visual signal — the actual crossover confirms it.
Example scenario: A stock has been declining for weeks. The MACD Line and Signal Line are both deep in negative territory. The histogram starts shrinking (red bars getting shorter). Then the MACD Line crosses above the Signal Line while both are still below zero. This is an early signal of a potential trend reversal — but not confirmation yet. Once the MACD Line also crosses above zero, trend reversal is confirmed.
Signal 2 — Bearish Crossover
A bearish crossover is the mirror image: the MACD Line crosses below the Signal Line. Short-term momentum is slowing and falling faster than the medium-term average. This is a potential sell or short signal.
How to trade it:
- The most powerful bearish crossovers occur above the zero line — ideally at a market top after a sustained rally.
- Watch for the histogram shifting from green to red. The bars shrinking is the advance warning; the crossover is the signal.
- Do not short every bearish MACD crossover in a strong bull market. Use higher-timeframe trend context first.
Signal 3 — MACD Divergence (The Most Powerful Signal)
Divergence occurs when the price chart and the MACD indicator are telling contradictory stories. This is a leading indicator — it warns of potential reversals before they happen on the price chart.
Bullish Divergence
Price makes a lower low, but MACD makes a higher low. This means even though the price is still falling, the momentum behind the decline is weakening. Buyers are quietly stepping in. A reversal up is likely.
Real-world example: A stock drops from ₹500 to ₹450 (MACD also drops). Then it falls again to ₹430 (a lower low on price). But this time, MACD only drops to, say, −15 instead of −25 (a higher low on MACD). Price and MACD are diverging — bullish divergence is in play. Enter long when price starts recovering, with a stop below ₹430.
Bearish Divergence
Price makes a higher high, but MACD makes a lower high. The rally is losing momentum internally even though price is still climbing. Distribution by smart money is likely occurring.
Real-world example: A stock rallies from ₹500 to ₹600 (MACD also rises). It pulls back, then rallies again to ₹640 (a higher high). But MACD on this second peak only reaches, say, +18 instead of the original +28. Bearish divergence signals the rally is exhausted. Consider reducing longs or entering a short with a stop above ₹640.
Quick Reference — MACD Signal Table
| Condition | Momentum Meaning | Trading Bias |
|---|---|---|
| MACD Line above zero | Bullish momentum | Favour longs |
| MACD Line below zero | Bearish momentum | Favour shorts |
| Histogram bars growing | Momentum accelerating | Stay in trend |
| Histogram bars shrinking | Momentum fading | Prepare for reversal |
| Bullish crossover below zero | Early reversal signal | Watch for confirmation |
| Bearish crossover above zero | Early reversal signal | Watch for confirmation |
| Bullish divergence | Hidden buying pressure | Strong long setup |
| Bearish divergence | Hidden selling pressure | Strong short/exit setup |
MACD Settings — Default vs. Customized
The default MACD settings (12, 26, 9) work well for most swing traders on daily charts. However, different timeframes benefit from different settings:
- Day traders (5m/15m charts): Use faster settings like (5, 13, 4) to reduce lag on intraday moves.
- Swing traders (4H/Daily): The default (12, 26, 9) is optimal and widely respected.
- Position traders (Weekly): Consider (19, 39, 9) for less noise on longer-term charts.
Avoid over-optimizing MACD settings for specific historical data — this leads to curve-fitting that fails in live markets.
Common MACD Mistakes That Cost Traders Money
- Trading every crossover without trend context. In a downtrend, bullish MACD crossovers fail frequently. Always check the higher-timeframe direction first.
- Ignoring the histogram. The histogram shows momentum velocity — arguably more important than the crossover itself. Shrinking bars before a crossover are an early warning system.
- Using MACD alone as the sole signal. MACD works best combined with support/resistance levels, volume analysis, and a clear understanding of the larger trend.
- Missing divergence setups. Most traders focus exclusively on crossovers and miss divergence entirely — which is statistically the more reliable signal.
- Not having a stop loss. MACD signals fail. Always define your risk before entering. Place stops at the recent structural low (for longs) or structural high (for shorts).
MACD vs. RSI — When to Use Which
Both MACD and RSI are momentum indicators, but they measure different things and work best in different market conditions:
- Use MACD to identify trend direction, momentum strength, and potential reversals. It works especially well in trending markets.
- Use RSI to identify overbought/oversold conditions and divergence in ranging, sideways markets. RSI gives cleaner signals when price is oscillating without a clear trend.
- Combine both: Use MACD for the trend/momentum read on the daily chart, then use RSI on the 4H chart to time your entry at an oversold or overbought extreme.
For a detailed RSI guide, see the RSI Indicator Infographic.
The MACD + Price Action Combination
The most reliable MACD setups occur when the indicator signal aligns with a key price action level:
- Identify a major support or resistance level on the daily chart.
- Wait for price to approach that level.
- Look for a MACD signal (crossover or divergence) as price tests the level.
- Enter only when price action confirms (a reversal candlestick like a hammer, engulfing, or pin bar at the level).
This triple confirmation — price level + MACD signal + candlestick pattern — dramatically improves the probability of a successful trade.
Frequently Asked Questions
What is the best MACD setting for day trading?
For day trading on 5-minute or 15-minute charts, try faster settings like (5, 13, 4) or (3, 10, 16). The default (12, 26, 9) introduces too much lag on very short timeframes. That said, many professional day traders prefer to use MACD only for direction bias on the daily chart and execute trades using pure price action on intraday charts.
Is MACD a leading or lagging indicator?
MACD is primarily a lagging indicator — it is derived from moving averages, which by definition react to past price data. However, MACD divergence acts as a leading indicator because it warns of potential reversals before they appear on the price chart. This dual nature makes MACD more useful than pure lagging indicators.
Can MACD work in sideways markets?
MACD performs poorly in sideways, choppy markets because it generates frequent false crossovers with no follow-through. In ranging conditions, RSI and Bollinger Bands are more reliable. Only trade MACD signals when there is a clear trending structure on the chart.
How do I confirm a MACD divergence signal?
A MACD divergence signal is confirmed when: (1) the divergence is clearly visible across at least two distinct swing highs or lows, (2) the MACD crossover occurs after the divergence is established, and (3) price action confirms with a reversal candlestick pattern at a key support or resistance level. Never trade divergence without a price action trigger.
Should I use MACD on every stock or asset?
MACD works best on liquid assets with clear trending behavior — major indices, large-cap stocks, major forex pairs, and liquid crypto assets. It performs poorly on highly illiquid assets or those with erratic, news-driven price action where moving averages have little predictive value.
Your Next Step
Download the free MACD Indicator Guide infographic as a quick reference for your trading desk. Pair it with the RSI Indicator Guide to build a complete momentum analysis framework. For risk management rules that protect your capital regardless of which indicator you use, see the 5 Golden Rules of Trading Risk Management.


