Key Takeaways
- A pivot point calculator determines potential support and resistance levels using previous price data.
- Pivot points help traders predict market trends and reversals.
- The most common pivot methods include Standard, Fibonacci, Camarilla, and Woodie pivot points.
- Our pivot calculator supports multiple pivot formulas, allowing traders to select the method that suits their strategy.
- Pivot points are commonly used in intraday trading, forex trading, and technical analysis.
Trading success often depends on identifying the right support and resistance levels. One of the most widely used technical indicators for this purpose is the pivot point.
A pivot point calculator helps traders quickly determine important price levels that indicate potential market direction. Instead of manually calculating pivot levels, traders can instantly generate them using an automated tool.
In this guide, you will learn how pivot points work, how to calculate them, and how to use a pivot calculator to analyze markets like stocks, forex, and cryptocurrencies.
What is a Pivot Point?
A pivot point is a technical analysis indicator used by traders to determine possible support and resistance levels in the market.
It is calculated using three key price values from the previous trading period:
-
High
-
Low
-
Close
These values are used to determine the pivot level, which acts as the main reference point for predicting market direction.
Quick Definition (Featured Snippet Optimized)
A pivot point is a technical indicator used in trading to identify potential support and resistance levels based on the previous period’s high, low, and closing prices. Traders use pivot points to predict market direction and identify possible entry or exit points.
Why Traders Use Pivot Points
Pivot points are popular among traders because they provide clear price levels that can guide trading decisions.
Key Benefits
-
Helps identify support and resistance levels
-
Indicates potential market trend direction
-
Supports intraday trading strategies
-
Works across multiple markets (stocks, forex, crypto)
“Pivot points are among the simplest yet most effective indicators used in technical trading.”
— Technical Trading Analysts
Pivot Point Calculator – How It Works
A pivot point calculator automatically computes important trading levels using historical price data.
Instead of manually applying formulas, traders simply enter:
-
High price
-
Low price
-
Closing price
The calculator then generates:
-
Pivot Point (P)
-
Support Levels (S1, S2, S3)
-
Resistance Levels (R1, R2, R3)
This helps traders quickly identify potential price reversal zones.
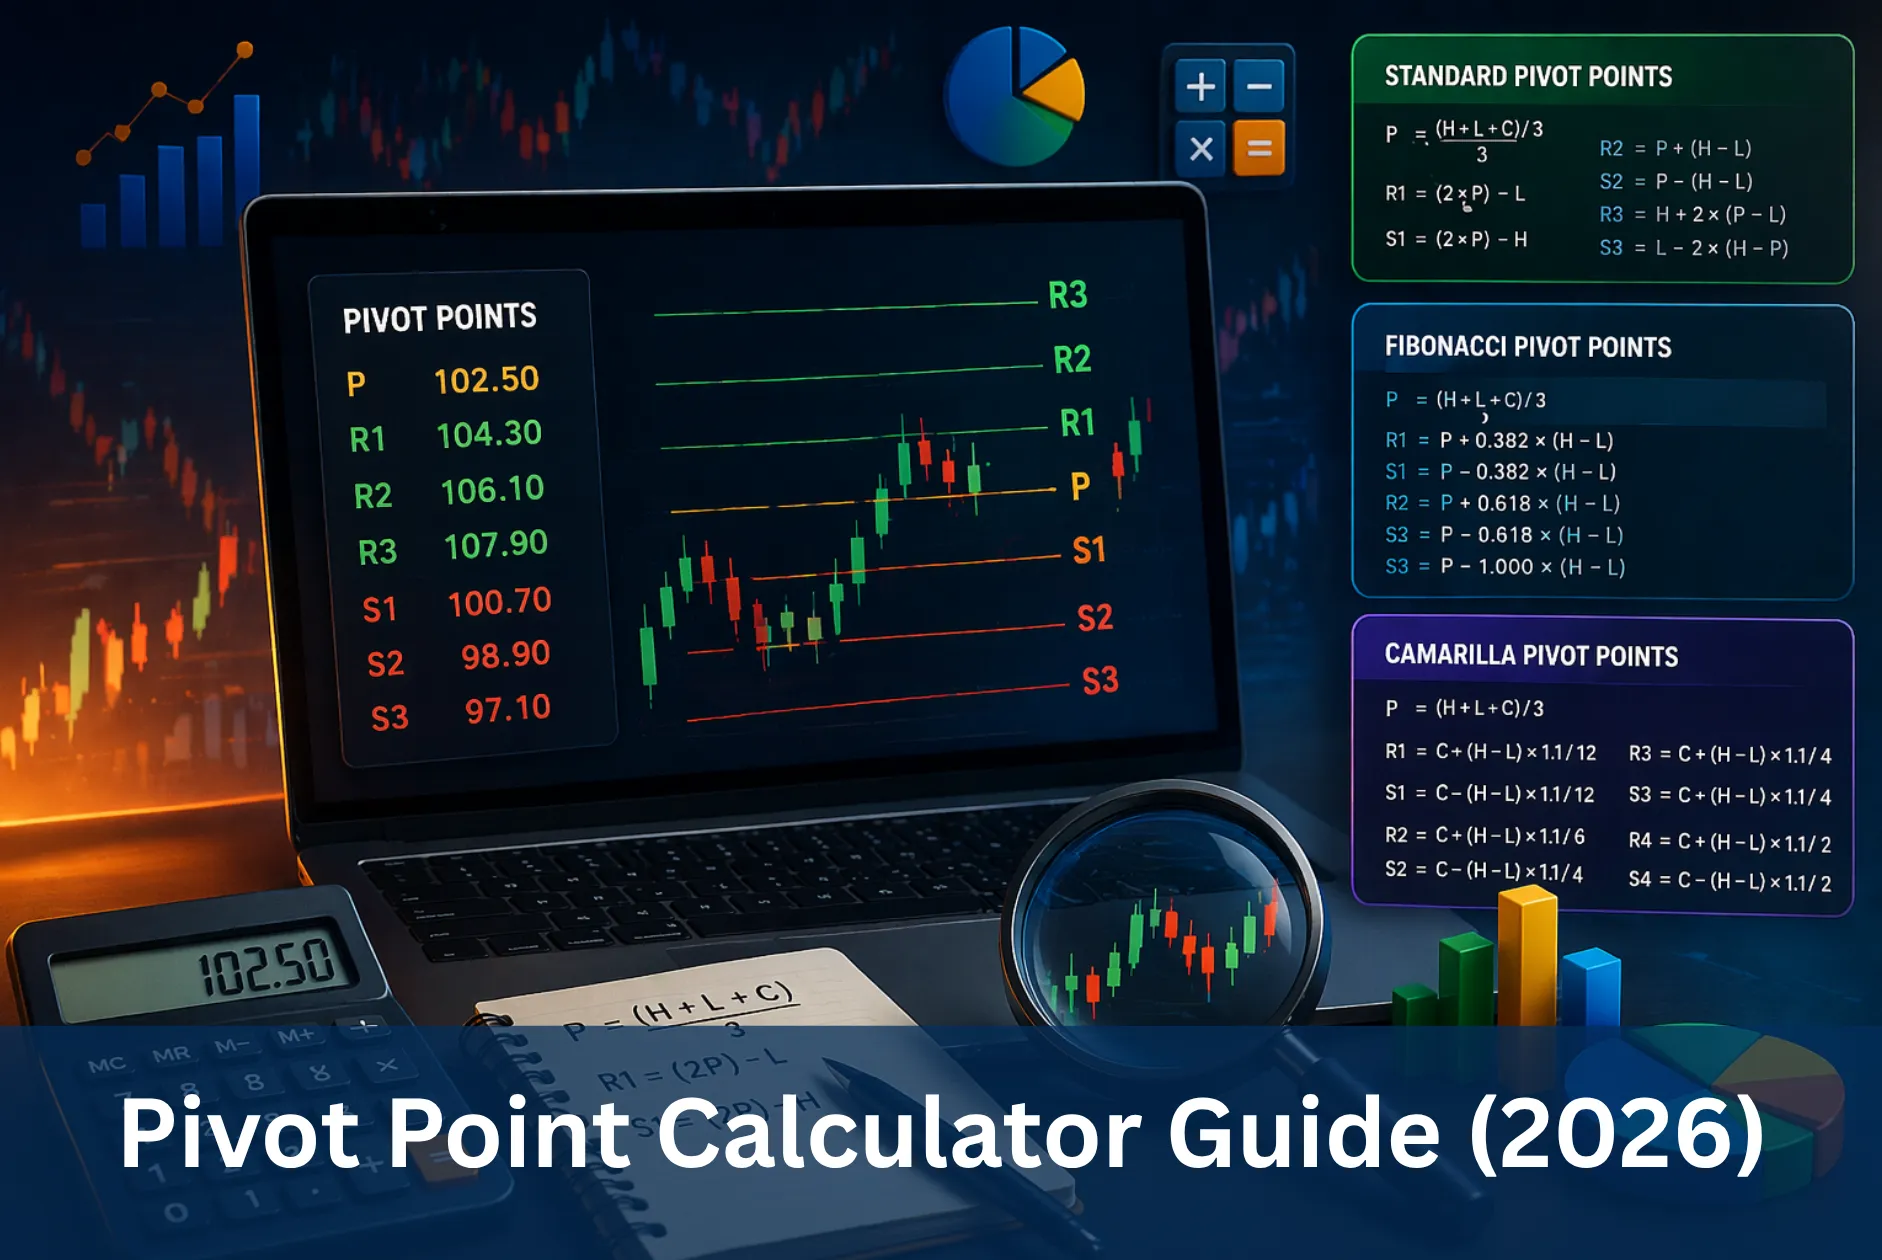
Pivot Point Formula Explained
The basic pivot point formula is straightforward.
Pivot Point Formula
Pivot Point (P):
[
P = (High + Low + Close) / 3
]
Once the pivot level is calculated, support and resistance levels are determined.
Standard Support & Resistance
|
Level |
Formula |
|
Resistance 1 (R1) |
(2 × Pivot) − Low |
|
Support 1 (S1) |
(2 × Pivot) − High |
|
Resistance 2 (R2) |
Pivot + (High − Low) |
|
Support 2 (S2) |
Pivot − (High − Low) |
Types of Pivot Point Calculations
Different trading strategies use different pivot formulas.
Our pivot point calculator supports multiple pivot calculation methods so traders can choose the most suitable approach.
|
Pivot Type |
Best For |
|
Standard Pivot Points |
General trading |
|
Fibonacci Pivot Points |
Forex and crypto |
|
Camarilla Pivot Points |
Intraday trading |
|
Woodie Pivot Points |
Trend analysis |
Standard Pivot Points
Standard pivot points are the most commonly used pivot calculation method.
They are widely used by stock traders and technical analysts because they provide clear support and resistance levels.
Characteristics
-
Simple calculation
-
Widely used in technical analysis
-
Works well for daily trading
Standard pivot points are often used as the baseline trading indicator.
Fibonacci Pivot Points
Fibonacci pivot points combine pivot calculations with Fibonacci ratios.
These ratios are derived from the Fibonacci sequence, which is widely used in financial markets.
Common Fibonacci Ratios
-
38.2%
-
61.8%
-
100%
These ratios help determine potential price retracement levels.
Why Traders Use Fibonacci Pivot Points
-
Helps identify strong support/resistance zones
-
Popular among forex traders
-
Works well with Fibonacci retracements
Camarilla Pivot Points
Camarilla pivot points were designed for short-term and intraday trading strategies.
They use a different formula to generate closer support and resistance levels.
Key Characteristics
-
Designed for day trading
-
Generates tighter levels
-
Useful for quick price reversals
Many scalpers and intraday traders prefer this method.
Woodie Pivot Points
Woodie pivot points place greater emphasis on the closing price.
This approach helps traders analyze recent market momentum.
Features
-
Focus on closing price
-
Suitable for trending markets
-
Popular among professional traders
Why Our Pivot Point Calculator is Different
Most pivot calculators only support one calculation method.
Our pivot point calculator is designed to be more flexible and powerful.
Supported Pivot Methods
|
Calculation Method |
Description |
|
Standard Pivot |
Classic pivot calculation |
|
Fibonacci Pivot |
Uses Fibonacci ratios |
|
Camarilla Pivot |
Intraday trading method |
|
Woodie Pivot |
Momentum-focused calculation |
Advantages of Our Tool
✔ Supports multiple pivot formulas
✔ Instant calculations
✔ Works for stocks, forex, and crypto
✔ Completely free to use
✔ Beginner-friendly interface
This allows traders to choose the pivot strategy that matches their trading style.
How to Use a Pivot Point Calculator
Using a pivot point calculator is simple.
Step-by-Step Guide
-
Enter the previous period's high price
-
Enter the low price
-
Enter the closing price
-
Select the pivot calculation type
-
Click calculate
-
View pivot, support, and resistance levels
Within seconds, the tool generates important trading levels.
Pivot Point Trading Strategies Explained
Pivot points are widely used by traders to identify potential support and resistance levels and determine possible market direction. However, simply knowing the pivot levels is not enough , traders must apply strategies to interpret price movement around those levels.
Below are some of the most commonly used pivot point trading strategies that traders use across markets like stocks, forex, and cryptocurrencies.
1. Pivot Breakout Strategy
The pivot breakout strategy focuses on identifying strong market momentum when price moves beyond the pivot level.
The pivot point acts as a central balance point for the market. When the price crosses this level decisively, it often signals a shift in sentiment.
How It Works
-
If the price breaks above the pivot point, it indicates bullish momentum.
-
If the price breaks below the pivot point, it signals bearish pressure.
Traders often wait for a strong candle close above or below the pivot level before entering a trade to confirm the breakout.
Example
Imagine a stock with a pivot point of ₹100:
-
If the price moves above ₹100 and continues rising, traders may enter a buy position.
-
If the price falls below ₹100, traders may enter a sell position.
Tips for Breakout Trading
✔ Wait for confirmation candles
✔ Monitor trading volume during breakout
✔ Set stop-loss slightly below/above pivot level
Breakout strategies work particularly well during high-volume trading sessions, such as the opening hours of stock markets.
2. Support Bounce Strategy
The support bounce strategy focuses on price reactions at support levels like S1, S2, and S3.
Support levels are areas where buying pressure often increases, preventing the price from falling further.
How It Works
When price approaches a support level:
-
Buyers may step in
-
The price may bounce upward
-
Traders look for buy opportunities
Example Scenario
If price drops toward S1 and forms a bullish candlestick pattern (like a hammer or bullish engulfing), traders may consider entering a long position.
For example:
-
Pivot = ₹100
-
S1 = ₹95
If the price drops to ₹95 and rebounds, traders may expect a move back toward pivot level ₹100.
When This Strategy Works Best
This strategy works best when:
✔ Market is range-bound
✔ There is low volatility
✔ Support levels have historical significance
Many intraday traders rely on this strategy because support levels often act as temporary price floors.
3. Resistance Reversal Strategy
The resistance reversal strategy is the opposite of the support bounce strategy.
Resistance levels such as R1, R2, and R3 often act as price ceilings where selling pressure increases.
How It Works
When price approaches resistance levels:
-
Sellers begin entering the market
-
Price momentum slows
-
The market may reverse downward
Example Scenario
If price reaches R1 and shows signs of weakness (like a shooting star or bearish engulfing candle), traders may enter a short position.
Example values:
-
Pivot = ₹100
-
R1 = ₹105
If the price hits ₹105 and fails to break higher, traders may anticipate a drop back toward pivot level.
Confirmation Signals
Traders often look for confirmation such as:
✔ Bearish candlestick patterns
✔ Overbought signals in RSI
✔ Decreasing trading volume
Combining resistance levels with other indicators improves accuracy.
Advantages of Using Pivot Points
Pivot points remain popular among traders because they provide clear, objective price levels for decision-making.
Unlike complex indicators, pivot points rely on simple mathematical calculations based on previous price data.
Key Advantages
1. Easy to Calculate
Pivot points are calculated using only three values:
-
Previous day high
-
Previous day low
-
Previous day closing price
Because of this simplicity, traders can quickly determine pivot levels without complex tools.
2. Clear Support and Resistance Levels
Pivot points automatically generate multiple levels:
-
Pivot Point (PP)
-
Resistance Levels (R1, R2, R3)
-
Support Levels (S1, S2, S3)
These levels help traders anticipate where price may reverse or break out.
3. Works Across Multiple Markets
Pivot points are not limited to a single market. They work effectively in:
-
Stock markets
-
Forex trading
-
Cryptocurrency trading
-
Commodity markets
Because the calculations rely only on price data, pivot points are universally applicable.
4. Useful for Short-Term Trading
Pivot points are especially popular among:
-
Day traders
-
Scalpers
-
Intraday traders
These traders rely on pivot levels to identify quick entry and exit opportunities during a trading session.
Many professional traders incorporate pivot points as part of their daily technical analysis routine.
Limitations of Pivot Points
Although pivot points are helpful, traders should understand that they are not perfect indicators.
Like all technical tools, pivot points have limitations that must be considered.
Common Limitations
1. Based Only on Historical Price Data
Pivot points rely entirely on past price movements. They do not consider:
-
Market news
-
Economic data
-
Company fundamentals
Because of this, sudden market events may cause price to ignore pivot levels completely.
2. May Produce False Signals
Markets can sometimes move briefly above or below pivot levels before reversing.
This creates false breakouts, which can trap traders in losing positions.
3. Works Best When Combined with Other Indicators
Professional traders rarely rely on pivot points alone.
Instead, they combine pivot levels with additional indicators to improve accuracy.
Common combinations include:
-
Moving averages
-
RSI (Relative Strength Index)
-
MACD (Moving Average Convergence Divergence)
Using multiple indicators helps confirm trading signals.
Best Practices for Pivot Point Trading
To maximize the effectiveness of pivot point analysis, traders should follow several best practices.
These techniques help reduce risk and improve trading decisions.
Trading Tips
Combine Pivot Points with Other Indicators
Using pivot levels alongside technical indicators provides stronger confirmation signals.
For example:
-
Pivot + RSI for overbought/oversold confirmation
-
Pivot + Moving Averages for trend confirmation
-
Pivot + MACD for momentum analysis
Use Higher Timeframe Confirmation
Many traders analyze pivot points on multiple timeframes.
For example:
-
Use daily pivots for intraday trading
-
Use weekly pivots for swing trading
Higher timeframe levels often carry stronger market influence.
Avoid Trading During Extreme Volatility
Major news events, earnings announcements, or economic reports can cause sudden price spikes.
During such periods, pivot levels may lose reliability.
Always Use Stop-Loss Orders
Risk management is critical in trading.
Always place stop-loss orders to protect capital in case the market moves against your position.
Successful traders prioritize capital preservation over aggressive profit seeking.
Conclusion
Pivot points are one of the most practical tools used in technical trading. By identifying potential support and resistance levels, traders can make more informed decisions.
Instead of manually calculating formulas, using a pivot point calculator allows traders to instantly generate pivot levels and analyze market conditions.
With support for Standard, Fibonacci, Camarilla, and other pivot methods, our calculator provides traders with the flexibility to apply different strategies across various markets.
Whether you trade stocks, forex, or cryptocurrencies, pivot points can become a powerful part of your trading strategy.
People Also Ask (FAQs)
What is a pivot point calculator?
A pivot point calculator is a tool that calculates support and resistance levels using previous price data such as high, low, and closing prices.
How accurate are pivot points?
Pivot points are widely used in technical analysis and provide reliable support and resistance levels, especially for intraday trading.
Which pivot point method is best?
Standard pivot points are the most common, while Fibonacci and Camarilla pivot points are preferred for forex and intraday trading strategies.
Can pivot points be used for crypto trading?
Yes. Pivot points can be used for cryptocurrency, forex, and stock trading to identify key price levels.
Do professional traders use pivot points?
Yes. Many professional traders use pivot points along with other indicators to identify market trends and entry points.