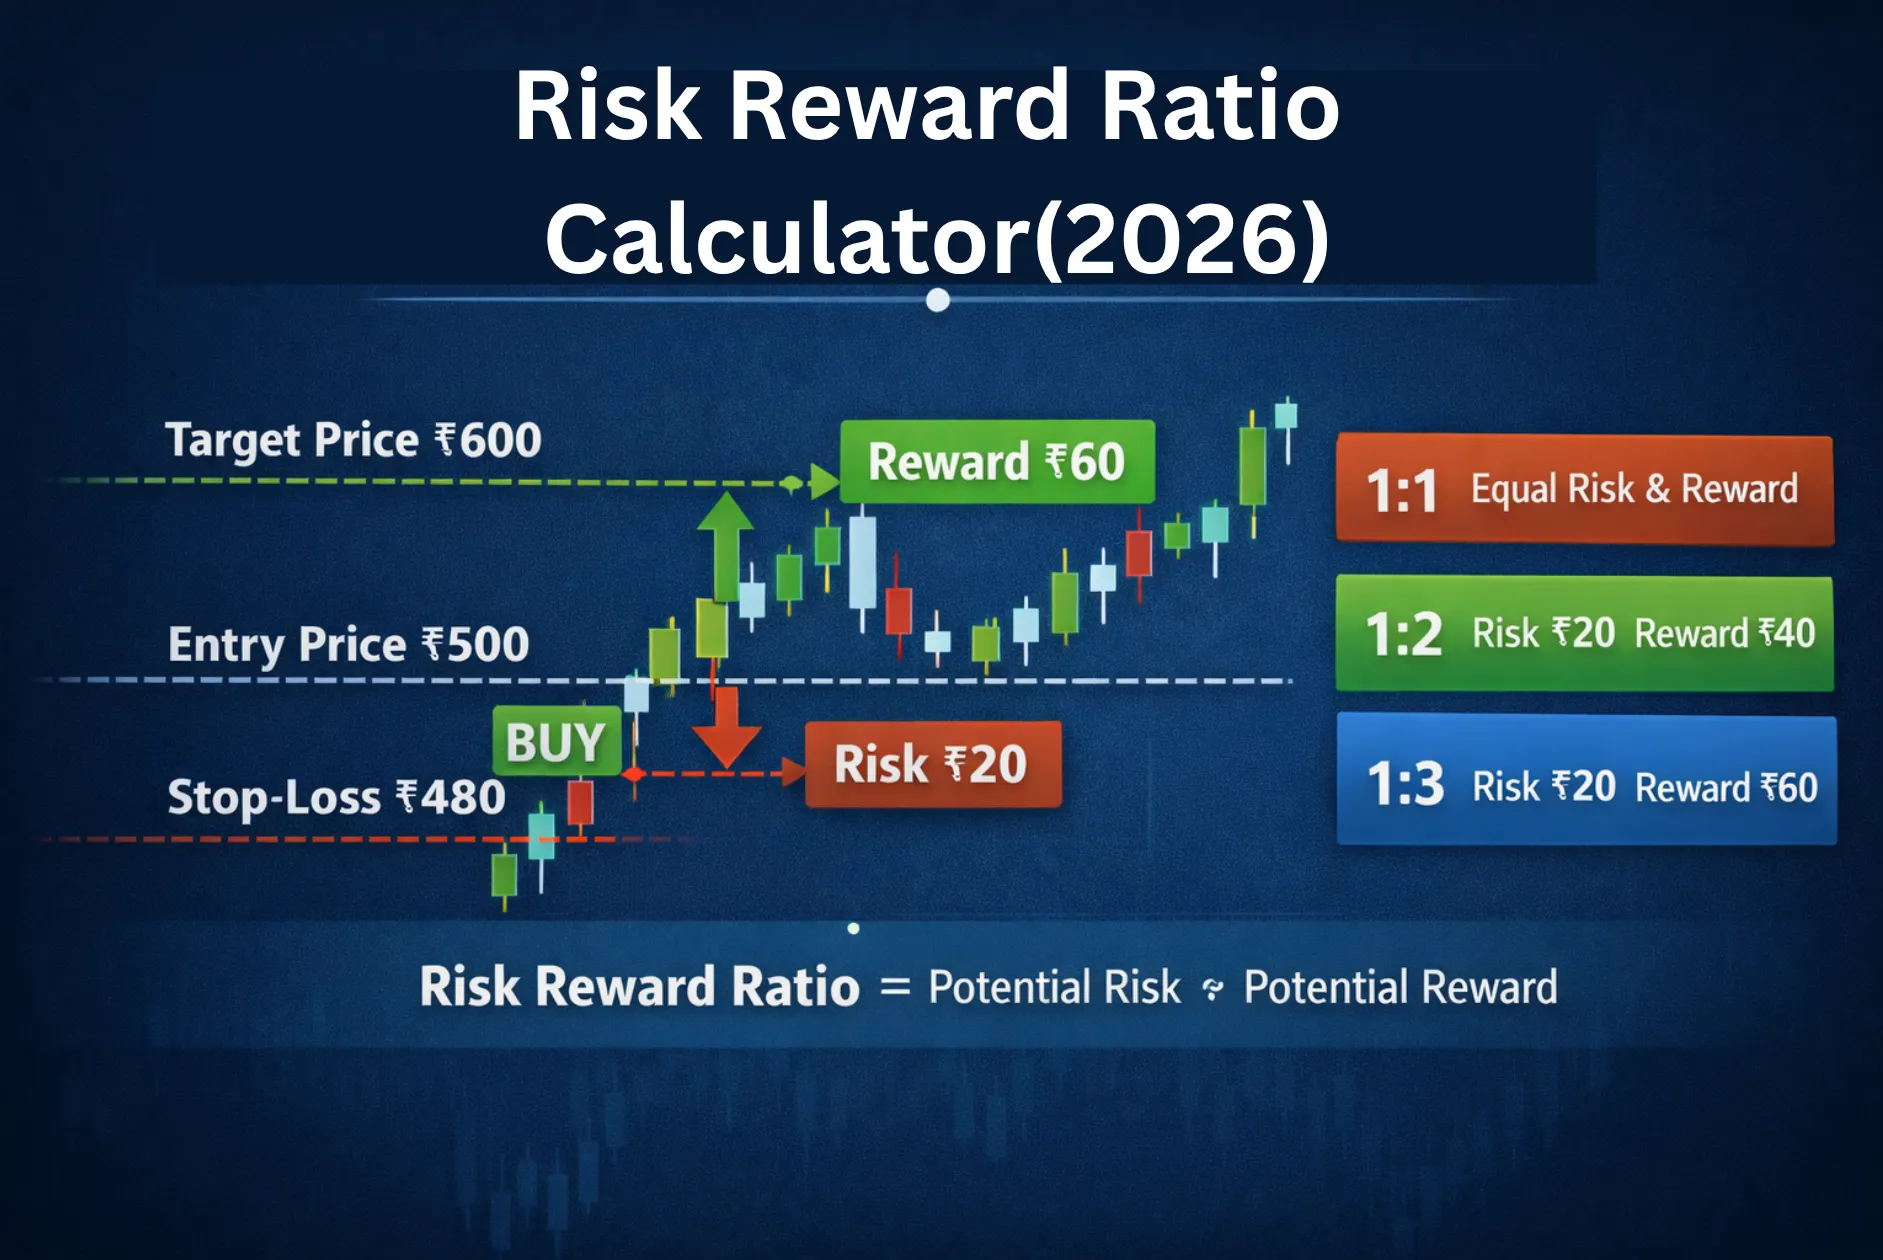
Key Takeaways
- Pivot points are automatic support and resistance levels calculated from the previous day's high, low, and close prices.
- Traders use them to identify where the market is likely to reverse or break out, without doing any manual chart analysis.
- The central pivot point (PP) acts as a daily market bias indicator: price above it signals bullish sentiment, price below it signals bearish.
- Combined with confirmation signals and proper risk management, the pivot point trading strategy is one of the most reliable and beginner-friendly tools in technical analysis, especially for NIFTY, Bank NIFTY, and F&O stocks.
- Free pivot point calculators are available on smdevs.in.
What Is Pivot Point Trading Strategy?
Every morning, before markets open, thousands of professional traders across India and globally are doing the same quiet ritual. They take the previous day's high, low, and closing price, and run a simple calculation. Within seconds, they have a map of the trading day in front of them. Seven price levels. Automatic. Objective. No guesswork.
Those levels are called pivot points. They are calculated using various types of Pivot Point Calculators
The pivot point trading strategy is a method of using these pre-calculated price levels, a central pivot point (PP) and a series of support (S1, S2, S3) and resistance (R1, R2, R3) levels, to make trading decisions throughout the day. When price approaches any of these levels, a trader watches for one of two things: a bounce (reversal) or a breakout (continuation).
"Pivot points are the floor trader's secret weapon. They create clear, objective lines in the sand that the market consistently respects." — John Person, Author of Candlestick and Pivot Point Trading Triggers
What makes pivot points so popular is their objectivity. Unlike hand-drawn support and resistance lines, which vary from one chart reader to another, pivot points are calculated using a fixed formula. Every trader using the same formula gets the same levels. That shared visibility is exactly what makes the levels powerful: they work partly because so many market participants are watching them simultaneously.
This is what traders call a self-fulfilling prophecy. When enough participants expect price to react at a level and position accordingly, the price actually does react there. Pivot points are one of the clearest examples of this in all of technical analysis.
The History Behind Pivot Points: From Floor Traders to Algo Systems
Pivot points did not originate on computer screens. They were invented on the actual trading floors of commodity and futures exchanges in the United States, think the Chicago Mercantile Exchange in the 1970s and 80s.
Floor traders (also called "pit traders") needed a fast, simple way to figure out where the market was likely to go during the session. They had no computers, no real-time screens with indicators. What they did have was yesterday's data: the high, the low, and the close. They came up with a mental formula, average those three prices, and you have a "pivot" around which today's price is likely to revolve.
From the floor, the concept moved to technical analysis textbooks and trading software. By the 1990s, it was a staple of forex and futures trading. Today, pivot point logic is baked into algorithmic trading systems, high-frequency trading models, and institutional desk setups worldwide.
The reason pivot points have survived decades of changing markets, new asset classes, and the rise of machine learning? They are simple, they are objective, and they consistently describe where market participants pay attention.
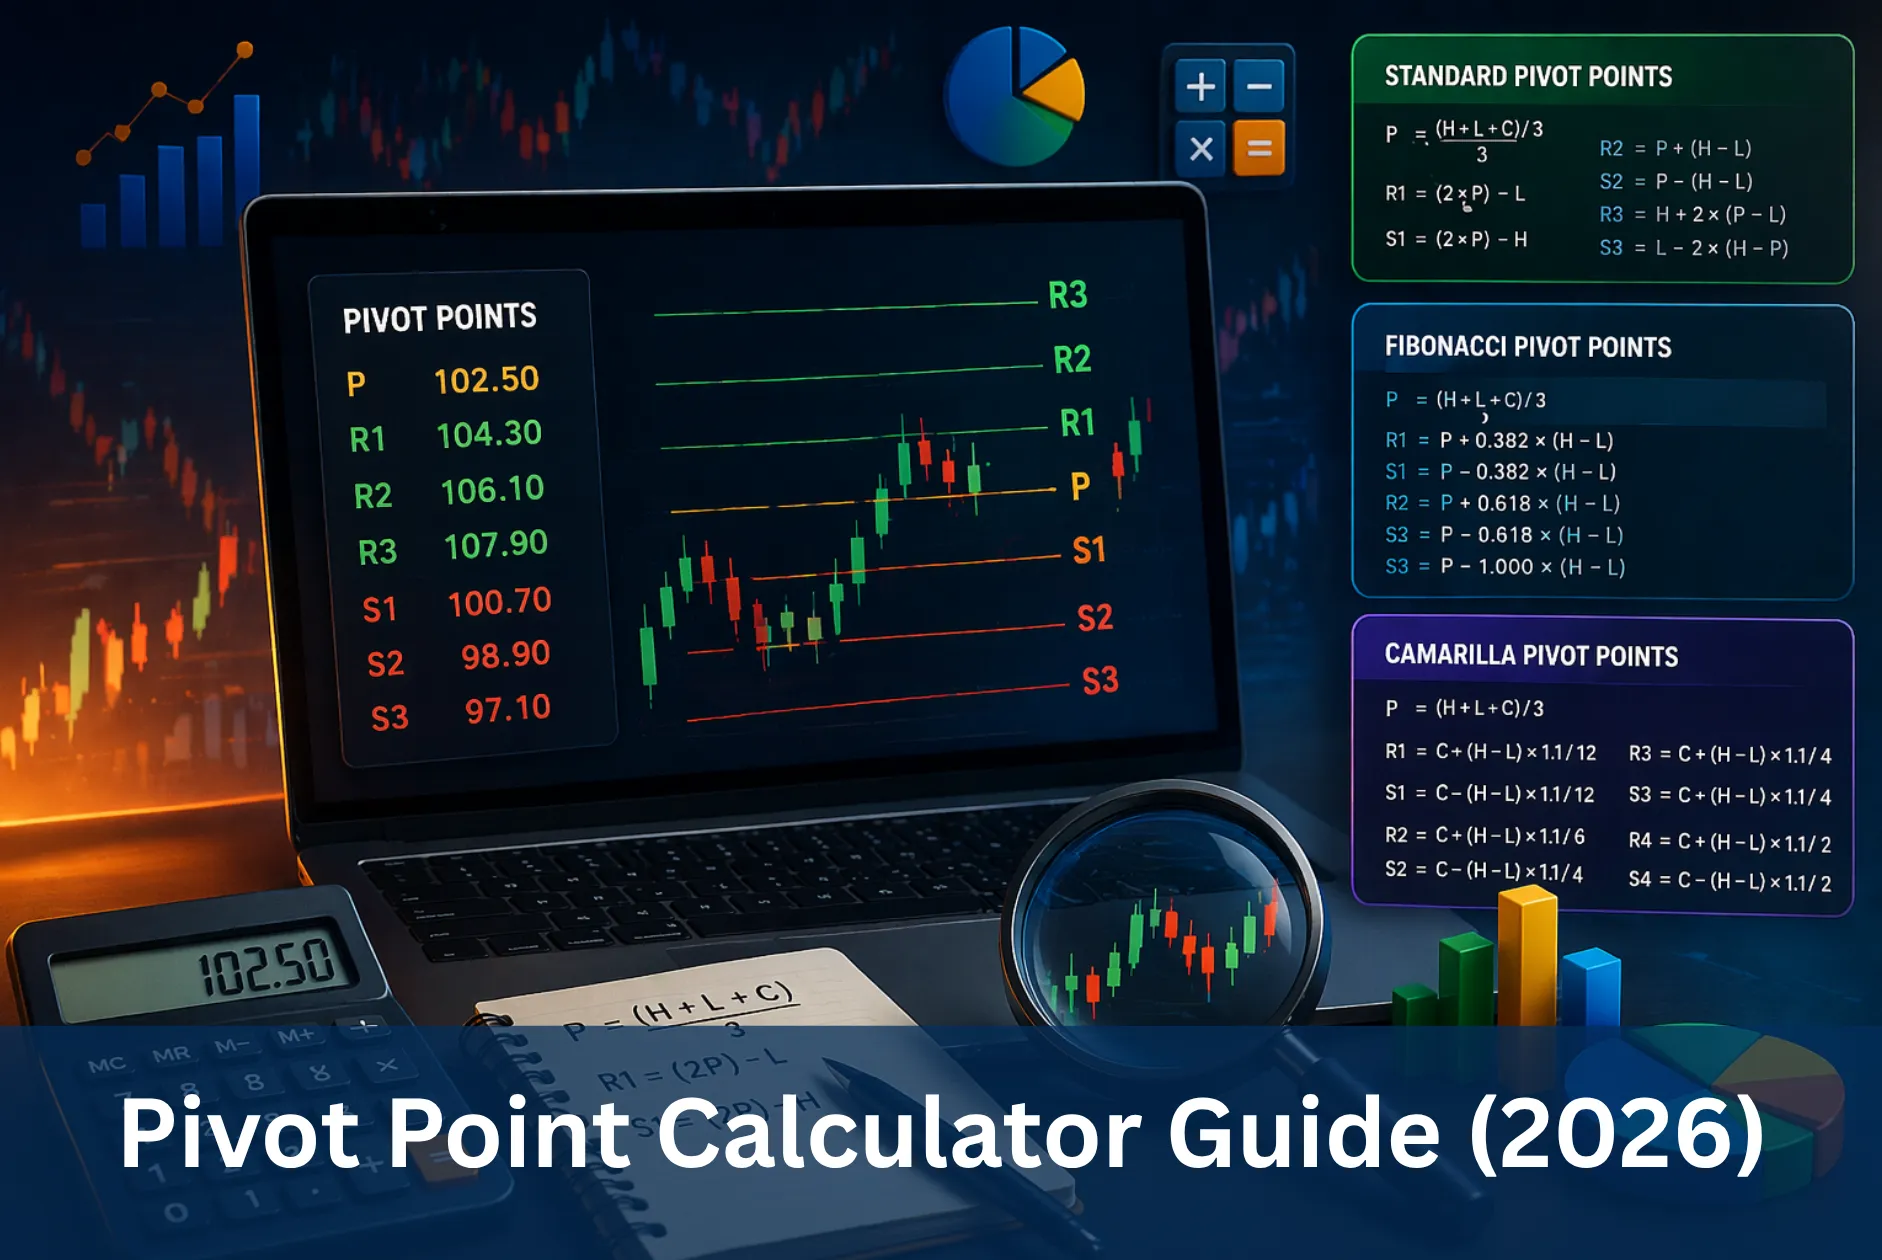
How to Calculate Pivot Points: Formula and Step-by-Step Example
The standard pivot point formula requires just three inputs from the previous trading day:
-
H = Previous Day's High
-
L = Previous Day's Low
-
C = Previous Day's Close
Standard Pivot Point Formula
PP = (H + L + C) ÷ 3
R1 = (2 × PP) – L
R2 = PP + (H – L)
R3 = H + 2 × (PP – L)
S1 = (2 × PP) – H
S2 = PP – (H – L)
S3 = Low – 2 × (H – PP)
Worked Example: NIFTY 50
Assume the previous trading day for NIFTY had:
-
High: 23,500
-
Low: 23,100
-
Close: 23,350
Step 1 — Calculate the Pivot Point: PP = (23,500 + 23,100 + 23,350) ÷ 3 = 23,316.67
Step 2 — Calculate Resistance Levels:
-
R1 = (2 × 23,316.67) – 23,100 = 23,533.34
-
R2 = 23,316.67 + (23,500 – 23,100) = 23,716.67
-
R3 = 23,500 + 2 × (23,316.67 – 23,100) = 23,933.34
Step 3 — Calculate Support Levels:
-
S1 = (2 × 23,316.67) – 23,500 = 23,133.34
-
S2 = 23,316.67 – (23,500 – 23,100) = 22,916.67
-
S3 = 23,100 – 2 × (23,500 – 23,316.67) = 22,733.34
Your complete NIFTY pivot map for the next trading session:
|
Level |
Value |
Meaning |
|
R3 |
23,933 |
Extreme resistance , rare but significant |
|
R2 |
23,717 |
Strong resistance, second target in a bullish day |
|
R1 |
23,533 |
First resistance , first profit target on long trades |
|
PP |
23,317 |
Central bias marker , bullish above, bearish below |
|
S1 |
23,133 |
First support , first target on short trades |
|
S2 |
22,917 |
Strong support, second target in a bearish day |
|
S3 |
22,733 |
Extreme support , usually only hit on heavy selling days |
You now have a complete trading map ready before the market even opens.
Types of Pivot Points: Which One Should You Use?
Not all pivot points are created equal. Different formulas exist, each suited to different market conditions and trading styles.
|
Type |
Best For |
Key Difference |
|
Standard (Classic/Floor) |
All traders; universal starting point |
Simple average of H, L, C; most widely used |
|
Fibonacci |
Traders already using Fibonacci; forex, gold |
Uses Fibonacci ratios (0.382, 0.618, 1.0) to calculate S/R instead of arithmetic spreads |
|
Camarilla |
Scalpers and intraday reversal traders |
8 tightly-spaced levels; assumes price reverts to previous close; great for catching quick reversals |
|
Woodie's |
Traders who prioritise the closing price |
Gives double weight to the closing price in the PP calculation; faster to react to recent price action |
|
DeMark's |
Trend-following traders |
Conditional formula; PP calculation changes based on whether close was above or below open |
Which Type Works Best in India?
For NIFTY and Bank NIFTY intraday trading, the Standard (Classic) pivot and Camarilla pivot are the most widely used. Standard pivots provide the broadest map, while Camarilla pivots are preferred by scalpers targeting tight reversals near the open.
Fibonacci pivots work exceptionally well on commodities like Gold (MCX) and Crude Oil, where Fibonacci retracement logic has a strong historical accuracy.
When in doubt, start with the standard pivot point formula. It is the most universally watched, which makes the levels inherently more meaningful.
How to Read Market Bias Using Pivot Points
This is the part most beginner traders skip , and it is arguably the most valuable use of pivot points.
Before placing a single trade, look at where the current price is relative to the central pivot point (PP).
The Daily Bias Rule
Price above PP → Bullish bias for the day → Favour long trades Price below PP → Bearish bias for the day → Favour short trades
It is that simple. But the detail matters:
|
Opening Scenario |
Market Interpretation |
Trading Bias |
|
Opens above PP, holds above PP |
Strong bullish day likely |
Look for longs near PP, S1 as support |
|
Opens above PP, falls below PP |
Bearish reversal signal |
Caution , wait for confirmation; possible short |
|
Opens below PP, holds below PP |
Strong bearish day likely |
Look for shorts near PP, R1 as resistance |
|
Opens below PP, reclaims PP |
Bullish reversal signal |
Caution , wait for confirmation; possible long |
|
Opens at or near PP |
Indecision / consolidation day |
Wait for price to clearly break one side |
"The Pivot Point is the most important level of the day. Everything revolves around it. It tells you who is in control , the bulls or the bears." — Mark Fisher, Author of The Logical Trader
The first 15–20 minutes after the market opens are critical. A stock or index that opens above the pivot, dips to test it, and bounces back above shows that buyers are defending the level , a far stronger bullish signal than one that simply gaps up and stays there without any test.
CPR (Central Pivot Range): The Most Overlooked Pivot Tool in India
If you trade NIFTY or Bank NIFTY options intraday, there is a pivot-based concept you absolutely must know , yet almost every English-language competitor article misses it entirely.
It is called the Central Pivot Range (CPR), and it is one of the most popular tools among Indian retail traders on NSE.
What Is CPR?
CPR is a zone , not a single level. It consists of three values:
BC (Bottom Central) = (H + L) ÷ 2
TC (Top Central) = (PP – BC) + PP
PP (Pivot Point) = (H + L + C) ÷ 3
The range between BC and TC forms the Central Pivot Range. Think of it as the market's "comfort zone" for the day.
How to Interpret CPR
Narrow CPR (BC and TC are close together): A narrow CPR signals that the previous day's range was tight. It often predicts a trending, directional day ahead. When price breaks out of a narrow CPR, the move tends to be strong.
Wide CPR (BC and TC are far apart): A wide CPR signals a volatile previous session. The upcoming day tends to be more sideways, with price likely to remain within the CPR or rotate between its edges.
|
CPR Width |
Likely Next Day Behaviour |
Strategy |
|
Very Narrow |
Trending day (breakout expected) |
Wait for breakout above TC or below BC; trade in direction of break |
|
Moderate |
Mixed; watch for reaction at TC/BC |
Trade bounces off TC/BC edges |
|
Very Wide |
Sideways/choppy day |
Avoid overtrading; trade only at outer S/R levels (R2, S2) |
CPR as a Weekly Levels Tool
Many Indian traders calculate weekly CPR using the previous week's high, low, and close. Overlapping weekly and daily CPR zones create some of the highest-probability trade setups of the week , especially on Monday and Tuesday when price tends to establish direction relative to the weekly CPR.
This CPR-based analysis is a genuine edge that most English-language articles completely ignore. It is, however, widely taught in Indian trading communities and used by many full-time options traders.
3 Core Pivot Point Trading Strategies (With Entry, Stop-Loss, Target)
Once you understand how to read pivot levels and daily bias, you are ready to apply them in actual trades. Here are the three core strategies used by most pivot point traders.
Strategy 1: The Pivot Bounce (Reversal Trade)
This is the most common pivot strategy. It works best in range-bound, sideways markets where price oscillates between support and resistance without breaking out.
Setup for a Long (Buy) Trade:
-
Market is in a sideways or mild uptrend
-
Price drops to S1 or S2
-
A bullish confirmation candle forms at the level , hammer, bullish engulfing, or pin bar
-
Enter long above the high of the confirmation candle
-
Stop-loss: below S2 (for S1 trades) or below S3 (for S2 trades)
-
Target: next pivot level up (PP for an S1 trade, then R1)
Setup for a Short (Sell) Trade:
-
Market is in a sideways or mild downtrend
-
Price rises to R1 or R2
-
A bearish confirmation candle forms , bearish engulfing, shooting star, or dark cloud cover
-
Enter short below the low of the confirmation candle
-
Stop-loss: above R2 (for R1 trades) or above R3 (for R2 trades)
-
Target: next pivot level down (PP for an R1 trade, then S1)
Risk:Reward for the Bounce Strategy: Typically 1:2 to 1:3 , the distance between pivot levels often creates natural, well-defined R:R setups.
Strategy 2: The Pivot Breakout (Momentum Trade)
This strategy targets trending days where price breaks through a pivot level with momentum and continues in that direction. It requires patience , false breakouts are the biggest risk, so confirmation is essential.
Setup for a Breakout Long:
-
Price is above PP (bullish daily bias confirmed)
-
Price consolidates just below R1, then breaks out above it
-
Confirmation: A full candle closes above R1 , not just a wick
-
Ideal confirmation: Volume spikes on the breakout candle
-
Enter long on the first candle that opens above R1 after the close
-
Stop-loss: below R1 (the broken level now acts as support)
-
Target: R2, then R3 on strong trending days
Setup for a Breakout Short:
-
Price is below PP (bearish daily bias confirmed)
-
Price consolidates just above S1, then breaks below it
-
Confirmation: A full candle closes below S1
-
Enter short on the first candle that opens below S1 after the close
-
Stop-loss: above S1
-
Target: S2, then S3 on strong trending days
"The best breakouts happen fast and don't look back. If price breaks R1 and immediately returns to it on the next candle, that is a red flag , not a buying opportunity."
Key rule: Never chase a breakout that is already 2–3 full candles old. The setup has passed. Wait for the next pivot level.
Strategy 3: Pivot Point + CPR Opening Range Strategy (Indian Intraday)
This strategy is specifically designed for NIFTY and Bank NIFTY intraday traders. It combines the CPR levels with the opening 15-minute candle to define the day's direction.
The Setup:
-
Calculate the CPR (TC and BC) before the market opens
-
Note whether CPR is narrow (trending day likely) or wide (choppy day likely)
-
Wait for the first 15 minutes of the session (9:15 AM to 9:30 AM on NSE)
-
Identify the high and low of this Opening Range candle
Trading Rules:
-
If price breaks above the Opening Range high AND is above TC, it signals a bullish trending day → look for long entries on the first pullback to TC or the Opening Range high (now support)
-
If price breaks below the Opening Range low AND is below BC, it signals a bearish trending day → look for short entries on the first bounce to BC or the Opening Range low (now resistance)
-
If price is chopping within the CPR during the first 15 minutes on a wide CPR day → avoid trading until price clearly breaks TC or BC
Stop-Loss: Opposite side of the CPR (TC for short trades, BC for long trades) Target: R1/R2 for longs, S1/S2 for shorts
This strategy combines the structural insight of CPR with the confirmation of the Opening Range , two frameworks that amplify each other's signals.
Pivot Points for NIFTY and Bank NIFTY Intraday Trading
India's most actively traded instruments , NIFTY 50 and Bank NIFTY , are ideal candidates for pivot point analysis. Here is why:
High liquidity: NIFTY and Bank NIFTY have some of the highest options open interest in the world. High liquidity means price respects technical levels with greater consistency.
Daily settlement: F&O contracts on NSE settle based on daily prices, which makes previous-day high/low/close data extremely relevant for the next session's pivot calculation.
Volatility range: Bank NIFTY tends to move in wider daily ranges than NIFTY, which means pivot levels are more spread out and typically offer better risk:reward setups per trade.
A Practical NIFTY Example
Assume previous day's NIFTY data:
-
High: 23,500 | Low: 23,100 | Close: 23,350
Pivot levels (already calculated in the formula section above):
-
PP: 23,317 | R1: 23,533 | S1: 23,133
Scenario: NIFTY opens at 23,400 (above PP).
|
Time |
Price Action |
What to Do |
|
9:15 AM |
Opens at 23,400 (above PP = bullish bias) |
Note bullish day scenario |
|
9:30 AM |
Pulls back to test PP at 23,317, forms hammer candle |
Entry signal for long trade |
|
9:35 AM |
Entry above hammer high at ~23,340 |
Long entered; stop-loss below PP at 23,290 |
|
11:00 AM |
Price reaches R1 at 23,533 |
Book partial profit; trail stop to PP |
|
1:30 PM |
Price pushes toward R2 at 23,717 |
Book remaining position |
Risk: ~50 points | Reward: ~216 points on R1, ~377 points on R2 Risk:Reward: Approximately 1:4 to 1:7 on a clean trending day.
This is the kind of structural clarity that pivot points provide , before the market even opens.
How to Combine Pivot Points With Other Indicators
Pivot points are strong on their own, but they reach their highest probability when combined with confirming indicators. Here are the most effective combinations:
Pivot Points + RSI (Relative Strength Index)
RSI measures momentum. When price reaches a pivot support level (S1 or S2) and RSI is simultaneously showing oversold conditions (below 30), the probability of a bounce trade is significantly higher.
Signal:
-
Price at S1/S2 + RSI below 30 → High-probability bounce long
-
Price at R1/R2 + RSI above 70 → High-probability reversal short
Pivot Points + MACD
MACD confirms the direction of momentum. Use it to filter out low-quality breakout trades.
Signal:
-
Price breaks above R1 + MACD shows a bullish crossover → Confirmed breakout long
-
Price breaks below S1 + MACD shows a bearish crossover → Confirmed breakout short
Pivot Points + Moving Averages (EMA)
The 20 EMA and 50 EMA are commonly used alongside pivot levels to identify areas of confluence.
Signal:
-
Pivot level coincides with 20 EMA or 50 EMA → Zone of strong support/resistance
-
Price above both EMA and PP → Strongest bullish confirmation
Pivot Points + Volume
Volume is the most underrated confirmation tool for pivot-based trades.
Signal:
-
Price approaches R1 with falling volume → Weak breakout; likely to fail
-
Price approaches R1 with rising volume → Strong breakout; likely to continue
|
Indicator |
Role with Pivot Points |
Signal Type |
|
RSI |
Overbought/oversold confirmation |
Reversal confirmation |
|
MACD |
Momentum direction |
Breakout confirmation |
|
EMA (20/50) |
Dynamic support/resistance confluence |
Bias and entry filter |
|
Volume |
Breakout validity |
Strength confirmation |
Pivot Point Cheat Sheet: Quick Reference for Every Trader
Print this out or save it to your phone. This is everything you need to remember about pivot point trading in one place.
|
Scenario |
What It Means |
Action |
|
Price opens above PP |
Bullish day likely |
Favour longs; use PP and S1 as buy zones |
|
Price opens below PP |
Bearish day likely |
Favour shorts; use PP and R1 as sell zones |
|
Price tests S1 with bullish candle |
Potential bounce |
Enter long above candle high; stop below S2 |
|
Price tests R1 with bearish candle |
Potential reversal |
Enter short below candle low; stop above R2 |
|
Price breaks R1 with volume |
Trending breakout |
Enter long; stop at R1 (now support); target R2 |
|
Price breaks S1 with volume |
Trending breakdown |
Enter short; stop at S1 (now resistance); target S2 |
|
Narrow CPR on a pivot chart |
Trending day expected |
Wait for breakout direction; trade with momentum |
|
Wide CPR on a pivot chart |
Choppy day expected |
Trade only at outer levels; avoid intraday noise |
|
R3 or S3 reached |
Extreme move day |
Strongly consider reversals; often unsustainable |
Common Mistakes Traders Make With Pivot Points
Even traders who understand the theory make these errors consistently. Knowing them in advance will save you money.
Mistake 1: Trading every pivot level on every day Not all pivot levels are equally relevant. On a normal-range day, price often only visits PP, S1, and R1. Trading S2, S3, R2, or R3 setups without strong confirmation is a low-probability habit that generates overtrading.
Mistake 2: Ignoring the CPR width before trading A wide CPR means a choppy day is likely. Trading intraday reversals on a wide-CPR day is swimming against the tide. Check the CPR width before the market opens.
Mistake 3: Entering on a breakout without a candle close Many false breakouts occur when price briefly crosses a pivot level during the candle but closes back inside. Always wait for the candle to fully close beyond the level before entering.
Mistake 4: Using pivot points on low-liquidity stocks Pivot points are most reliable on heavily traded instruments , NIFTY, Bank NIFTY, large-cap F&O stocks like Reliance, TCS, and HDFC Bank. On thinly traded small-cap stocks, pivot levels are frequently breached without any meaningful reaction.
Mistake 5: Ignoring major news events On days with Union Budget announcements, RBI policy decisions, US Fed meetings, or significant global events, price can gap well beyond standard pivot levels at the open. On such days, the calculated pivot levels may be irrelevant for the first hour of trading. Respect the event risk first, then use the pivot levels.
Mistake 6: Not combining with any confirmation indicator Pivot points alone tell you where price might react. They do not tell you if it will. A single RSI reading or volume observation before entry can significantly improve the quality of your setups.
How to Use a Free Pivot Point Calculator
Calculating pivot points manually every morning is time-consuming and error-prone. That is where a free online pivot point calculator removes all friction from your pre-market routine.
How to use the smdevs.in Pivot Point Calculator:
-
Get previous day's data — Find yesterday's high, low, and close for your instrument (available on NSE website, TradingView, or your broker's platform)
-
Enter the values — Input H, L, and C into the calculator
-
Select pivot type — Choose Standard, Camarilla, Fibonacci, or Woodie's based on your trading style
-
Get your levels — The calculator instantly gives you PP, R1, R2, R3, S1, S2, S3 — and CPR (TC and BC) for Indian market traders
-
Mark your chart — Draw horizontal lines at each level on your charting platform before the market opens
Try the Free Pivot Point Calculator on smdevs
Other free tools on smdevs.in that work alongside pivot point trading:
Final Thoughts
The pivot point trading strategy is one of the few technical tools that has stood the test of time across decades, asset classes, and market regimes. From the commodity pits of Chicago in the 1970s to NSE's NIFTY options ring today , floor traders, retail traders, and algorithmic systems all use these levels because they consistently describe where markets pay attention.
Here is what separates traders who profit from pivot points from those who do not: discipline and confirmation. The levels give you a framework. Candlestick patterns, volume, RSI, and MACD confirm whether the framework is actually working in real time on that specific day.
If you are an intraday trader on Indian markets, add CPR analysis to your daily preparation. If you trade NIFTY options, knowing whether you are in a narrow-CPR trending day versus a wide-CPR choppy day could be the difference between a great session and a frustrating one.
Use the free pivot point calculator on smdevs.in every morning before the market opens. Mark your levels. Know your bias. Let the market come to you.
The best traders do not predict markets. They prepare for them.
Frequently Asked Questions(FAQs)
What is a pivot point in trading?
A pivot point is a price level calculated from the previous trading session's high, low, and close prices. It acts as a reference or equilibrium level for the current session. Price trading above the pivot suggests bullish sentiment; price below it suggests bearish sentiment. Additional support and resistance levels (S1, S2, S3 and R1, R2, R3) are calculated from the pivot to give traders a full framework of where the market may react during the day.
How do you calculate pivot points for intraday trading?
Use the standard formula: PP = (Previous High + Previous Low + Previous Close) ÷ 3
Then calculate:
-
R1 = (2 × PP) – Previous Low
-
R2 = PP + (High – Low)
-
S1 = (2 × PP) – Previous High
-
S2 = PP – (High – Low)
For Indian traders, also calculate CPR:
-
BC = (High + Low) ÷ 2
-
TC = (PP – BC) + PP
Or simply use a free pivot point calculator on smdevs.in to get all levels in seconds.
Which type of pivot point is best for trading NIFTY and Bank NIFTY?
For NIFTY intraday trading, the Standard (Classic) pivot is the most widely used and reliable, as it is watched by the largest number of market participants. For Bank NIFTY, where volatility is higher, many traders prefer Camarilla pivots because the tighter levels are better suited to the faster price movements. The CPR (Central Pivot Range) is particularly popular in Indian trading communities for gauging whether a day will trend or remain choppy.
Are pivot points leading or lagging indicators?
Pivot points are a leading indicator , they are calculated before the trading session begins, using the previous period's data. This means they project forward-looking price levels rather than reacting to current price movement the way lagging indicators like moving averages or MACD do. This is one of their key advantages: they give traders a map before the market even opens.
Can pivot points be used for swing trading, or are they only for intraday trading?
Pivot points work across timeframes. For swing trading, traders calculate pivot points using weekly data (previous week's H, L, C) instead of daily data. Weekly pivot levels act as stronger support and resistance zones that can hold for 3–5 trading days. Monthly pivots are used by positional traders and investors. The principles remain identical , only the input timeframe changes. Daily pivots are most commonly associated with intraday strategies, but weekly and monthly pivots are legitimate tools for longer-term setups.
Disclaimer: This blog is for educational purposes only and does not constitute financial or investment advice. Trading in futures and options involves substantial risk. Please consult a SEBI-registered investment advisor before making trading or investment decisions.