Key Takeaways
- The Performance report shows real Google data — clicks, impressions, CTR, average position per query
- Filter for Position 8–20 queries to find quick-win ranking opportunities
- Coverage report shows exactly why pages aren't indexed — check it weekly
- URL Inspection tool is your single-page diagnostic after any update or indexing issue
- GSC data has a 2–3 day lag and shows 16 months of history
Google Search Console (GSC) is the most powerful free SEO tool available — built by Google itself, directly reflecting how Google sees your website. Unlike third-party tools that estimate your data, GSC shows you actual Google data: which queries trigger your pages, how many clicks and impressions you receive, your average position for specific keywords, and critically — every indexing error, mobile usability issue, and Core Web Vitals problem affecting your rankings.
Despite being free and authoritative, most website owners either don't have GSC set up or barely scratch the surface of what it offers. This guide covers every key report and feature you need to use GSC effectively for SEO growth.
Setting Up Google Search Console
Before accessing any data, you need to verify ownership of your website. GSC offers five verification methods:
- HTML file upload: Download a file from GSC and upload it to your website's root directory — most reliable for technical users.
- HTML meta tag: Add a meta tag to your homepage's <head> section — easiest for CMS users (WordPress, Wix).
- Google Analytics: If GA4 is already installed with the same Google account, GSC can verify automatically.
- Google Tag Manager: Verify through GTM if it's already on your site.
- DNS record: Add a TXT record to your domain registrar — best for verifying entire domains including all subdomains.
Recommended: Add your site as a Domain property (not URL prefix) to capture data across all subdomains and both HTTP/HTTPS versions.
Key Takeaways
- The Performance report is your most valuable SEO data source. It shows real Google data — not estimates — for clicks, impressions, CTR, and average position per query.
- The Coverage report tells you exactly why pages aren't indexed. Check it weekly to catch indexing issues before they compound.
- Core Web Vitals report shows real user experience data. This is the field data Google actually uses for ranking, not lab scores from PageSpeed Insights.
- The URL Inspection tool is your single-page diagnostic. Use it whenever a page isn't appearing in search or after a significant update.
- GSC data has a 2–3 day delay and shows the most recent 16 months of data. Export regularly if you need longer-term trend analysis.
The Performance Report — Your SEO Command Centre
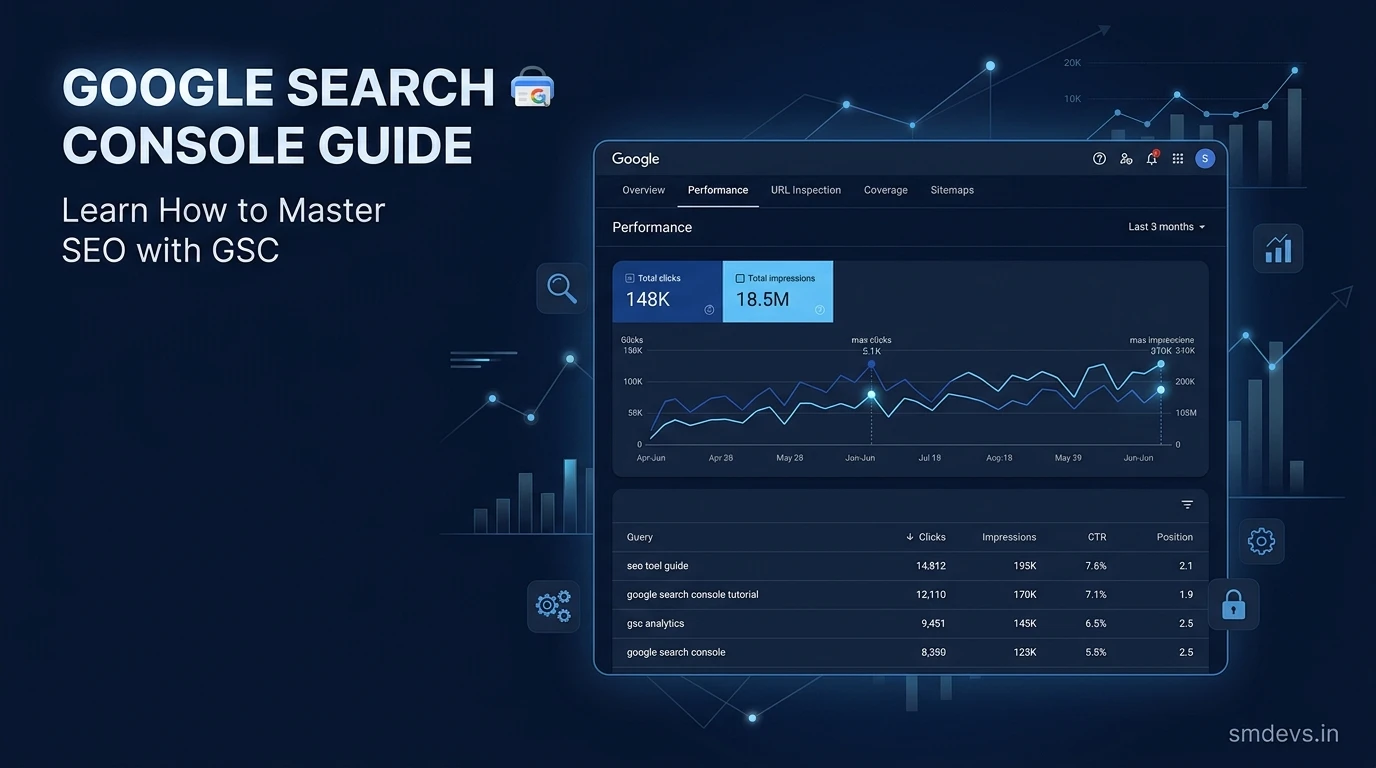
The Performance report is where you'll spend most of your time in GSC. It shows you four core metrics for every query, page, country, device, and date range:
- Total Clicks: How many times users clicked through to your site from Google search results.
- Total Impressions: How many times your pages appeared in search results (whether clicked or not).
- Average CTR (Click-Through Rate): Clicks ÷ Impressions. A low CTR on a high-impression query suggests your title tag or meta description needs improvement.
- Average Position: Your average ranking position for a query. Note: this averages across all positions the URL appeared — a page ranking #1 for some queries and #10 for others might show an "average" of #5.
High-value analysis workflows in the Performance report:
- Find quick-win keywords: Filter for queries where your Average Position is between 8–20 — these are near-page-one rankings that a targeted optimization push could move into positions 1–5, dramatically increasing clicks.
- Identify low-CTR pages: Sort by Impressions descending. Pages with high impressions but low CTR (under 2%) are receiving visibility but not clicks — a title tag and meta description rewrite can significantly increase traffic without changing rankings.
- Find content gaps: Look at the queries driving impressions to a page. If a page about "SEO tools" is getting impressions for "free SEO audit" queries, consider creating dedicated content for that topic.
- Monitor brand vs. non-brand split: Filter for queries that include your brand name vs. those that don't. Non-brand impressions show how well your SEO is working for topical queries.
The Coverage (Indexing) Report
The Coverage report (now called "Indexing" in updated GSC) shows the indexing status of every URL Google has discovered on your site. It categorizes URLs into four groups:
- Valid: Indexed and appearing in search results. These are working correctly.
- Valid with warnings: Indexed but with potential issues — check these. Common warning: "Indexed, though blocked by robots.txt" — Google indexed the page despite a robots.txt disallow (unusual and worth investigating).
- Excluded: Not indexed, but intentionally — these include noindex pages, canonical duplicates, and pages blocked by robots.txt. Review this section to ensure the right pages are excluded.
- Error: Not indexed due to a problem Google encountered — 404 errors, server errors, redirect issues. These need fixing.
Most important errors to fix immediately:
- Submitted URL not found (404): A URL in your sitemap returns a 404 error. Update your sitemap to remove dead URLs.
- Redirect error: A redirect chain is broken or creates a loop. Fix redirect chains to point directly to the final destination.
- Crawled — currently not indexed: Google crawled the page but chose not to index it, usually due to thin content, duplicate content, or low quality signals. Improve content depth.
- Discovered — currently not indexed: Google knows the URL exists but hasn't crawled it yet — usually a crawl budget issue. Add internal links from important pages to boost priority.
Core Web Vitals Report
This report shows LCP, INP, and CLS scores based on real user data from the Chrome User Experience Report (CrUX). Unlike PageSpeed Insights lab scores, this is the field data Google actually uses for ranking purposes.
The report categorizes pages into Good, Needs Improvement, and Poor groups for both mobile and desktop. Focus on fixing mobile Poor pages first — they have the most negative ranking impact.
See the Core Web Vitals Guide for detailed fix instructions for each metric.
The URL Inspection Tool
The URL Inspection tool is your single-page diagnostic for any URL on your site. Enter a URL and GSC shows you:
- Whether the URL is indexed and in Google's index
- The last crawl date and the HTTP response code
- The rendered HTML as Googlebot saw it (critical for JavaScript-rendered content)
- Detected structured data (schema markup) with validation status
- Any canonical tag Google detected and whether Google agrees with it
- Mobile usability status
When to use the URL Inspection tool:
- After publishing any new page — to request indexing and check for issues
- After a significant content update — to request recrawling
- When a page is missing from search results — to diagnose why
- After fixing technical issues — to confirm the fix is live and visible to Google
Sitemaps Report
Submit your XML sitemap here and GSC will show you: how many URLs you submitted, how many were indexed, and any sitemap parsing errors. Check this monthly.
Best practices: Keep your sitemap current — remove deleted or redirected URLs, add new pages promptly. For large sites, use sitemap index files that reference multiple individual sitemaps (up to 50,000 URLs per sitemap, 50MB uncompressed).
Links Report
Shows your site's top linked pages (both external backlinks and internal links), top linking sites, and top anchor text used in external links. Use this to:
- Identify which pages have the most external authority (inform your internal linking strategy — link from these pages to pages you want to rank)
- Audit your anchor text distribution — healthy profiles show a mix of branded, generic, and topical anchors
- Spot unexpected linking domains (potential spammy links worth monitoring)
Manual Actions Report
If Google has issued a manual penalty against your site — for unnatural links, thin content, cloaking, or other guideline violations — it appears here. Most sites will never see a manual action. Check it when: you notice a sudden, severe traffic drop that coincides with no algorithm update, or after a major content or link overhaul.
Weekly GSC Workflow (20 Minutes)
- Performance report: Compare last 28 days vs. previous 28 days — note significant wins or drops.
- Coverage report: Check for new errors in the Error tab — fix any 404s or server errors.
- Core Web Vitals: Check if any new Poor pages have appeared.
- Quick-win queries: Scan for Position 8–20 queries you haven't yet targeted with optimized content.
- New page submissions: Use URL Inspection to submit any pages published in the last week.
Frequently Asked Questions
How long does it take for Google Search Console to show data after setup?
After verifying your property, GSC begins collecting data immediately — but it takes 2–3 days for initial data to appear in reports, and up to 72 hours for processing delays. Historical data from before you verified is not retroactively available, so set up GSC as early as possible — even on a brand-new site — to start accumulating data from day one.
Why does my GSC data differ from Google Analytics?
GSC and GA4 measure different things. GSC measures search appearances and clicks from Google Search — pre-visit data. GA4 measures what happens after the user arrives on your site — sessions, page views, conversions. Discrepancies arise because: GSC counts clicks per search session (not per page view), GA4 may filter bot traffic that GSC counts, and users may click but then immediately return (counted in GSC, but may show as very short sessions in GA4). Use each tool for what it is designed for — GSC for search performance, GA4 for on-site behavior.
What does "Discovered — currently not indexed" mean?
This status means Google found your URL (through a sitemap or internal link) and added it to the crawl queue, but has not yet crawled and indexed it. This happens when Googlebot has limited crawl budget for your site or the URL is low priority. Fix it by: adding internal links from already-indexed high-authority pages on your site, ensuring the URL is included in your XML sitemap, and using the URL Inspection tool to request indexing for high-priority pages.
Can I use GSC for multiple websites?
Yes. A single Google account can have up to 1,000 properties (websites) in Google Search Console. Agencies and SEO professionals routinely manage hundreds of client sites through a single GSC account. Each property shows data only for that specific domain or URL prefix — there is no cross-property reporting within GSC itself (for that, use Google Looker Studio with the GSC data connector to build consolidated reports).
Your Next Step
If GSC isn't set up yet, do it now at search.google.com/search-console. Then run a full technical SEO health check with our SEO Structure Analyzer to surface issues GSC doesn't catch. Review the Google Crawl & Index Guide to understand what GSC's Coverage report data means in practice.