Key Takeaways
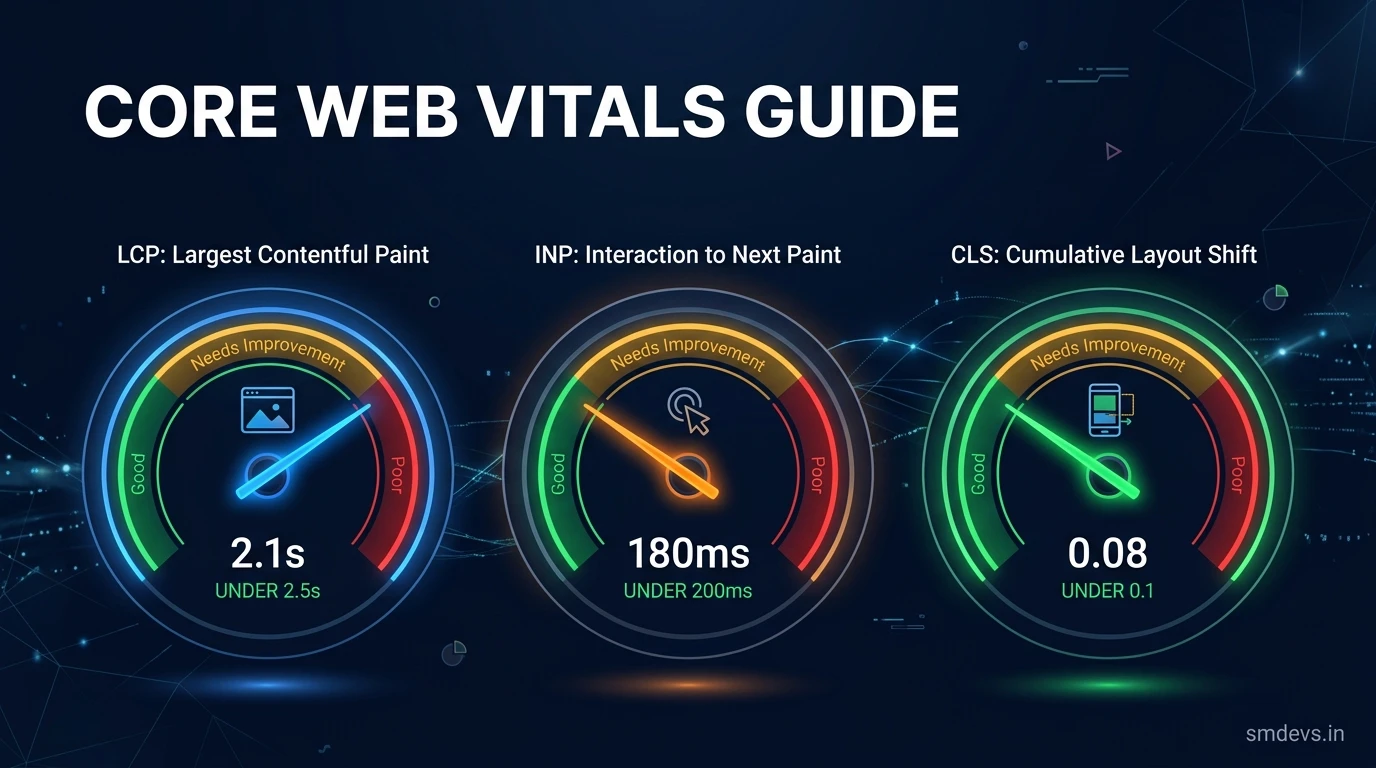
- LCP (Largest Contentful Paint) must be under 2.5 seconds — optimize images and server response
- INP (Interaction to Next Paint) must be under 200ms — reduce JavaScript blocking
- CLS (Cumulative Layout Shift) must be under 0.1 — always define image dimensions
- INP replaced FID in March 2024 — update your benchmarks
- Field data (CrUX) is what Google uses for ranking, not lab/PageSpeed scores
Core Web Vitals are Google's set of standardised, user-experience-focused performance metrics that directly influence search rankings. Since the Page Experience update rolled out in 2021, Core Web Vitals have been a confirmed ranking signal — and as of 2026, they remain one of the most actionable technical SEO levers available to site owners.
This guide explains all three Core Web Vital metrics in full detail, gives you the exact thresholds Google uses to evaluate them, and shows you how to diagnose and fix each one.
The Three Core Web Vitals
Google currently measures three Core Web Vitals:
- LCP (Largest Contentful Paint): Measures loading performance
- INP (Interaction to Next Paint): Measures interactivity and responsiveness
- CLS (Cumulative Layout Shift): Measures visual stability
Each metric has three performance bands: Good, Needs Improvement, and Poor. Google uses the 75th percentile of real user data (field data from the Chrome User Experience Report) to assess your page — meaning 75% of real visits to your page must meet the "Good" threshold for the page to pass.
Key Takeaways
- LCP target: under 2.5 seconds — the largest visible element must paint within 2.5s of the page starting to load.
- INP target: under 200 milliseconds — the page must respond to user interactions within 200ms.
- CLS target: under 0.1 — layout elements must not shift unexpectedly by more than a score of 0.1.
- Core Web Vitals affect rankings — Google uses them as a tiebreaker between pages of similar relevance and quality.
- INP replaced FID (First Input Delay) in March 2024 — if you are optimizing based on older guides that reference FID, update your benchmarks.
Metric 1 — LCP (Largest Contentful Paint)
LCP measures how quickly the largest visible content element on the page loads. This is typically a hero image, a large heading, or a video thumbnail — whatever occupies the most visual real estate above the fold.
Thresholds:
- Good: ≤ 2.5 seconds
- Needs Improvement: 2.5s – 4.0s
- Poor: > 4.0 seconds
What causes poor LCP:
- Unoptimized hero images (large file sizes, wrong formats)
- Render-blocking CSS or JavaScript that delays the browser from painting the largest element
- Slow server response times (Time to First Byte / TTFB)
- No CDN — content served from a geographically distant server
- Lazy-loading applied to the LCP element (the LCP image should never be lazy-loaded)
How to fix LCP:
- Optimize images: use WebP or AVIF format, compress to the smallest acceptable file size, and serve appropriately sized images for each viewport
- Add
fetchpriority="high"to your LCP image element so the browser prioritizes loading it - Preload the LCP image:
<link rel="preload" as="image" href="hero.webp"> - Optimize server response time (TTFB): use a CDN, enable server-side caching, upgrade hosting if needed
- Remove render-blocking resources: defer non-critical JS, inline critical CSS
Metric 2 — INP (Interaction to Next Paint)
INP measures the responsiveness of your page to user interactions — specifically, how quickly the page visually responds after a user clicks a button, taps a link, or types in an input field. It replaced the older FID (First Input Delay) metric in March 2024 because it measures the full interaction lifecycle, not just the initial delay.
Thresholds:
- Good: ≤ 200 milliseconds
- Needs Improvement: 200ms – 500ms
- Poor: > 500 milliseconds
What causes poor INP:
- Heavy JavaScript execution on the main thread that blocks interaction handling
- Long tasks (JavaScript tasks exceeding 50ms) that prevent the browser from responding to user input
- Large DOM size (thousands of DOM elements) that makes rendering updates slow
- Unoptimized third-party scripts (analytics, ads, chat widgets) that compete for main thread time
- Excessive React re-renders or framework-specific performance issues
How to fix INP:
- Break up long JavaScript tasks into smaller chunks using
setTimeoutorscheduler.yield() - Remove or defer third-party scripts that run on page load
- Audit and reduce JavaScript bundle size — tree-shake unused code, code-split by route
- Use the Chrome DevTools Performance panel to identify the specific long tasks causing INP delays
- Reduce DOM size: aim for under 1,500 total DOM nodes
Metric 3 — CLS (Cumulative Layout Shift)
CLS measures the visual stability of your page — specifically, how much page elements unexpectedly move around as the page loads. If you've ever been reading an article and had the text suddenly jump down because an ad loaded above it, you've experienced a high-CLS page.
Thresholds:
- Good: ≤ 0.1
- Needs Improvement: 0.1 – 0.25
- Poor: > 0.25
What causes poor CLS:
- Images without explicit width and height attributes — the browser cannot reserve space for them before they load
- Ads, embeds, or iframes without reserved dimensions
- Dynamically injected content above existing content (banners, cookie notices, newsletter popups)
- Web fonts causing FOUT (Flash of Unstyled Text) that shifts surrounding text
- Animations that change an element's dimensions (use transform instead)
How to fix CLS:
- Always include explicit
widthandheightattributes on every<img>element - Reserve space for ads and dynamic content using CSS aspect-ratio or fixed-height containers
- Use
font-display: optionalorswapto manage web font loading behaviour - Avoid inserting content above existing content unless triggered by user interaction
- Use CSS transform for animations instead of properties that trigger layout recalculations (top, left, width, height)
How to Measure Your Core Web Vitals
| Tool | Data Type | Best Used For |
|---|---|---|
| Google Search Console (Core Web Vitals report) | Field data (real users) | Overall site assessment, identifying pages with issues |
| PageSpeed Insights | Both field & lab data | Per-URL analysis with specific improvement recommendations |
| Chrome DevTools (Performance panel) | Lab data | Deep diagnosis of specific performance issues |
| Chrome User Experience Report (CrUX) | Field data | Aggregated real-user data for your domain |
| web.dev/measure | Lab data (Lighthouse) | Quick overall assessment |
Core Web Vitals and Rankings — What the Evidence Shows
Google has been clear that Core Web Vitals are a ranking factor but act as a "tiebreaker" — meaning relevance and authority still dominate. A highly relevant, authoritative page will outrank a technically perfect page on a less relevant topic.
However, the tiebreaker role is significant in practice: when two pages are closely matched in relevance and authority, Core Web Vitals can determine which one appears higher in the SERP. For competitive keywords where multiple high-authority sites rank closely, improving your Core Web Vitals can provide the marginal advantage needed to move from position 4 to position 1–3.
Frequently Asked Questions
What replaced FID in Core Web Vitals?
INP (Interaction to Next Paint) replaced FID (First Input Delay) as an official Core Web Vital in March 2024. FID only measured the delay before the browser could begin processing the first user interaction. INP measures the full responsiveness of the page across all user interactions throughout the entire page lifecycle, making it a more comprehensive and accurate measure of interactivity.
Do Core Web Vitals affect mobile and desktop rankings separately?
Yes. Google measures Core Web Vitals separately for mobile and desktop users. Mobile Core Web Vitals scores (based on mobile field data from real users) influence mobile search rankings, and desktop scores influence desktop rankings. Since most sites have significantly worse Core Web Vitals scores on mobile, this is often where the biggest ranking opportunities exist.
My PageSpeed score is high but my CrUX field data is poor. Which matters more?
Field data (CrUX) is what Google uses for ranking purposes — not lab-based PageSpeed scores. Field data reflects actual user experience on real devices with real network conditions. Lab data (PageSpeed Insights Lighthouse score) is useful for identifying issues to fix, but always optimize for your field data metrics as reported in Google Search Console's Core Web Vitals report.
How quickly do Core Web Vitals improvements affect rankings?
CrUX data is collected over a 28-day rolling window. This means improvements to your Core Web Vitals scores will take approximately 28 days to be fully reflected in the field data Google uses for ranking purposes. After implementing improvements, monitor your Google Search Console Core Web Vitals report over the following month to confirm the improvements are being captured in field data.
Your Next Step
Download the Core Web Vitals Guide infographic for a quick-reference threshold chart. Run your most important pages through PageSpeed Insights and Google Search Console to get your current scores. For a complete technical health check, use the SEO Audit Checklist infographic as your full reference.