Key Takeaways
- The RSI (Relative Strength Index) is one of the most widely used technical indicators in trading — and one of the most misused. Developed by J. Welles Wilder in 1978, RSI measures the speed and magnit
What is the RSI Indicator?
The Relative Strength Index (RSI) is a momentum oscillator that measures the speed and change of price movements on a scale of 0 to 100. It was developed by J. Welles Wilder Jr. and introduced in his 1978 book New Concepts in Technical Trading Systems.
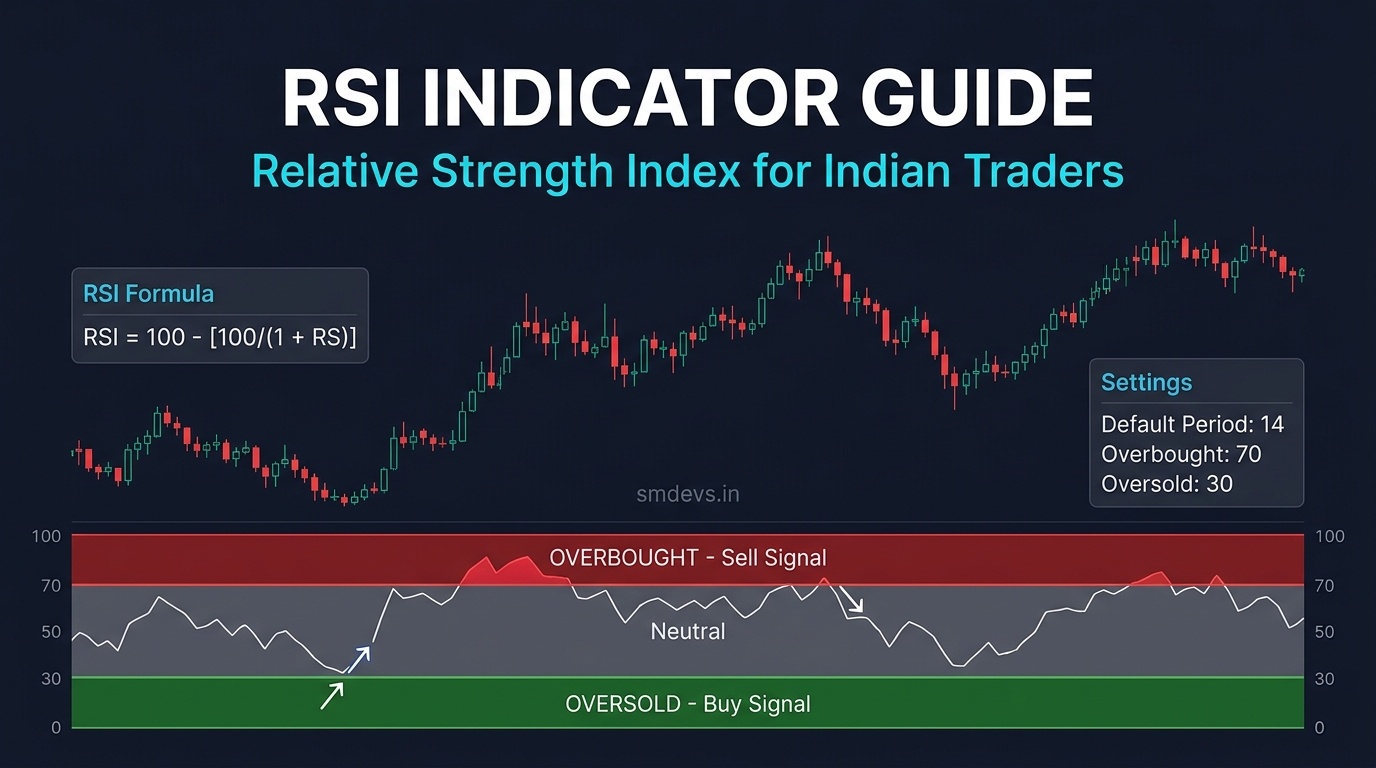
RSI oscillates between 0 and 100 and is typically displayed as a line chart below the main price chart:
- RSI above 70: Overbought zone — price has risen too fast; potential reversal or correction ahead
- RSI below 30: Oversold zone — price has fallen too fast; potential bounce or recovery ahead
- RSI between 30–70: Neutral zone — no strong signal; trend continuation more likely
RSI works alongside MACD as one of the two most popular momentum indicators for Indian traders. For MACD comparison, read: What is MACD Indicator?
RSI Formula: How is RSI Calculated?
RSI = 100 − [100 / (1 + RS)]
Where:
- RS = Average Gain over N periods ÷ Average Loss over N periods
- N = RSI period (default: 14)
Step-by-step calculation (14-period RSI):
- Take the last 14 candles (days, hours, or minutes depending on your timeframe)
- Separate the up-days (close > previous close) and down-days (close < previous close)
- Average Gain = Sum of gains over 14 periods ÷ 14
- Average Loss = Sum of losses over 14 periods ÷ 14
- RS = Average Gain ÷ Average Loss
- RSI = 100 − [100 ÷ (1 + RS)]
Example: If Average Gain = 1.5 and Average Loss = 0.5, RS = 3.0, RSI = 100 − [100 ÷ 4] = 100 − 25 = 75 (overbought territory)
In practice, you never calculate RSI manually — every charting platform (TradingView, Zerodha Kite, Upstox Pro) calculates it automatically. What matters is how to read and use it.
RSI Settings: Which Period to Use?
| Period | Sensitivity | Best For | Overbought/Oversold Levels |
|---|---|---|---|
| 9 | Very sensitive — many signals | Scalping, 1–5 min charts | 80/20 |
| 14 (default) | Balanced | Intraday (15m, 1h) and swing trading | 70/30 |
| 21 | Smooth — fewer signals | Positional and swing trades (daily chart) | 70/30 |
| 25 | Very smooth | Long-term trend analysis (weekly chart) | 65/35 |
For most Indian traders: 14-period RSI on the 15-minute chart for intraday, and 14-period RSI on the daily chart for swing trades.
4 RSI Trading Strategies for Indian Markets
Strategy 1: Overbought / Oversold Reversal
The most basic RSI strategy:
- Buy signal: RSI falls below 30 (oversold) and then rises back above 30 — suggests the selling pressure is exhausted
- Sell signal: RSI rises above 70 (overbought) and then falls back below 70 — suggests buying momentum is fading
- Stop loss: Below the recent swing low (for buy) or above recent swing high (for sell)
Important caveat: RSI can stay overbought (>70) for extended periods in a strong uptrend. Never short just because RSI is above 70 — wait for it to cross back below 70 before acting.
Strategy 2: RSI Divergence (Most Powerful Signal)
Divergence occurs when price and RSI move in opposite directions — this is one of the most reliable RSI signals:
Bullish Divergence (potential upward reversal):
- Price makes a new Lower Low
- But RSI makes a Higher Low (doesn't confirm the price low)
- Signal: Selling momentum is weakening even though price is still falling → expect a bounce
Bearish Divergence (potential downward reversal):
- Price makes a new Higher High
- But RSI makes a Lower High (doesn't confirm the price high)
- Signal: Buying momentum is weakening even though price is still rising → expect a pullback
Divergence works best on 1-hour and daily charts. On 1-minute or 5-minute charts, it produces too many false signals.
Strategy 3: RSI Midline (50) as Trend Filter
RSI crossing above or below the 50 midline signals a trend shift:
- RSI crosses above 50: Bullish momentum — look for buy setups; avoid short trades
- RSI crosses below 50: Bearish momentum — look for sell setups; avoid long trades
Use RSI 50 crossover as a trend filter to qualify your other strategies — only take RSI 30 buy signals when RSI is also trending above 50 on the higher timeframe.
Strategy 4: RSI + Support/Resistance (High-Probability Setups)
Combining RSI with key price levels dramatically improves signal quality:
- Identify a major support level (e.g., Nifty 24,000 — a round number and previous resistance turned support)
- Wait for price to reach that support
- Confirm RSI is at or near 30 (oversold) at that same level
- Enter long when RSI turns up from oversold at a key support
- Stop below the support level; target next resistance
This confluence approach (RSI oversold + price at support) produces the cleanest, most reliable RSI setups. Use our free Pivot Point Calculator to identify key support/resistance levels to pair with RSI signals.
RSI for Nifty 50 and Bank Nifty Trading
RSI works particularly well on NSE indices due to their high liquidity and smooth price action. Key observations for Indian index traders:
- Nifty daily RSI above 75: Historically has preceded short-term corrections of 2–5% within 2–4 weeks. Notable examples: Nifty RSI hit 80+ before the Jan 2022 correction, Oct 2021 peak, and Jan 2020 pre-COVID high.
- Nifty daily RSI below 30: Has historically marked major buying opportunities — March 2020 (COVID crash), Oct 2022 (FII selling), and Jun 2022 (global rate hike fear) all saw RSI touch 25–30 at the lows
- Bank Nifty: More volatile — RSI signals on 15-minute charts are more reliable than 5-minute charts due to higher noise on shorter timeframes
RSI vs MACD: Which is Better?
| Feature | RSI | MACD |
|---|---|---|
| Type | Momentum oscillator (bounded 0–100) | Trend-following momentum indicator (unbounded) |
| Primary use | Overbought/oversold levels; divergence | Trend direction; crossover signals |
| Best in | Ranging markets (clear overbought/oversold) | Trending markets (crossover signals) |
| Lag | Less lag — more reactive | More lag — slower but fewer false signals |
| Combined use | Use MACD for trend direction; RSI for entry timing — this combination is used by professional traders | |
Common RSI Mistakes to Avoid
- ❌ Shorting every RSI 70 touch: In a strong uptrend, RSI can stay above 70 for weeks. Always wait for RSI to cross back below 70 before considering a short.
- ❌ Using RSI in isolation: RSI alone is not a complete trading system. Always combine it with price action, support/resistance, and volume.
- ❌ Taking signals on very short timeframes: RSI on 1-minute or 2-minute charts produces noisy, unreliable signals. Minimum 15-minute for intraday; daily for swing trades.
- ❌ Ignoring the trend: In a downtrend, RSI 30 oversold bounces often fail. Trade RSI oversold signals only in the direction of the larger trend.
- ❌ Not using stop losses: RSI signals can and do fail. Every RSI trade needs a predefined stop loss — no exceptions.
FAQs: RSI Indicator
What is RSI in trading?
RSI (Relative Strength Index) is a momentum indicator that measures the speed and magnitude of recent price changes on a scale of 0 to 100. RSI above 70 suggests overbought conditions (too many buyers — price may fall). RSI below 30 suggests oversold conditions (too many sellers — price may bounce). It helps traders identify potential reversal points and assess trend strength.
What is the best RSI setting for intraday trading?
For intraday trading in Indian markets (Nifty, Bank Nifty, stocks): use 14-period RSI on the 15-minute chart for standard intraday, with overbought at 70 and oversold at 30. For scalping on 5-minute charts, some traders prefer 9-period RSI with 80/20 levels to reduce false signals. Always test settings on historical data before using live.
How reliable is RSI divergence?
RSI divergence is one of the more reliable RSI signals, but it is not perfect. Bullish divergence on a daily chart in an established support zone has a high success rate. Divergence on very short timeframes (1–5 min) fails frequently due to noise. The signal is strongest when: (1) it appears at a major support or resistance level, (2) the divergence spans at least 2–3 bars, and (3) it's confirmed by a RSI crossover of 30 or 70.
What is the difference between RSI 14 and RSI 21?
RSI 14 uses the last 14 periods for calculation — it's more sensitive and produces more trading signals, both valid and false. RSI 21 uses the last 21 periods — it's smoother, slower to react, produces fewer but often higher-quality signals. RSI 14 is the universal default and the most widely watched. RSI 21 is preferred by swing traders on daily charts who want to filter out short-term noise.


