Key Takeaways
- MACD (Moving Average Convergence Divergence) is one of the most popular and versatile technical indicators used by traders worldwide. Created by Gerald Appel in 1979, MACD helps identify trend directi
What is MACD?
MACD (Moving Average Convergence Divergence) is a trend-following momentum indicator that shows the relationship between two exponential moving averages (EMAs) of a security's price. It was developed by Gerald Appel in the late 1970s and remains one of the most widely used technical analysis tools in stock, forex, and commodity trading.
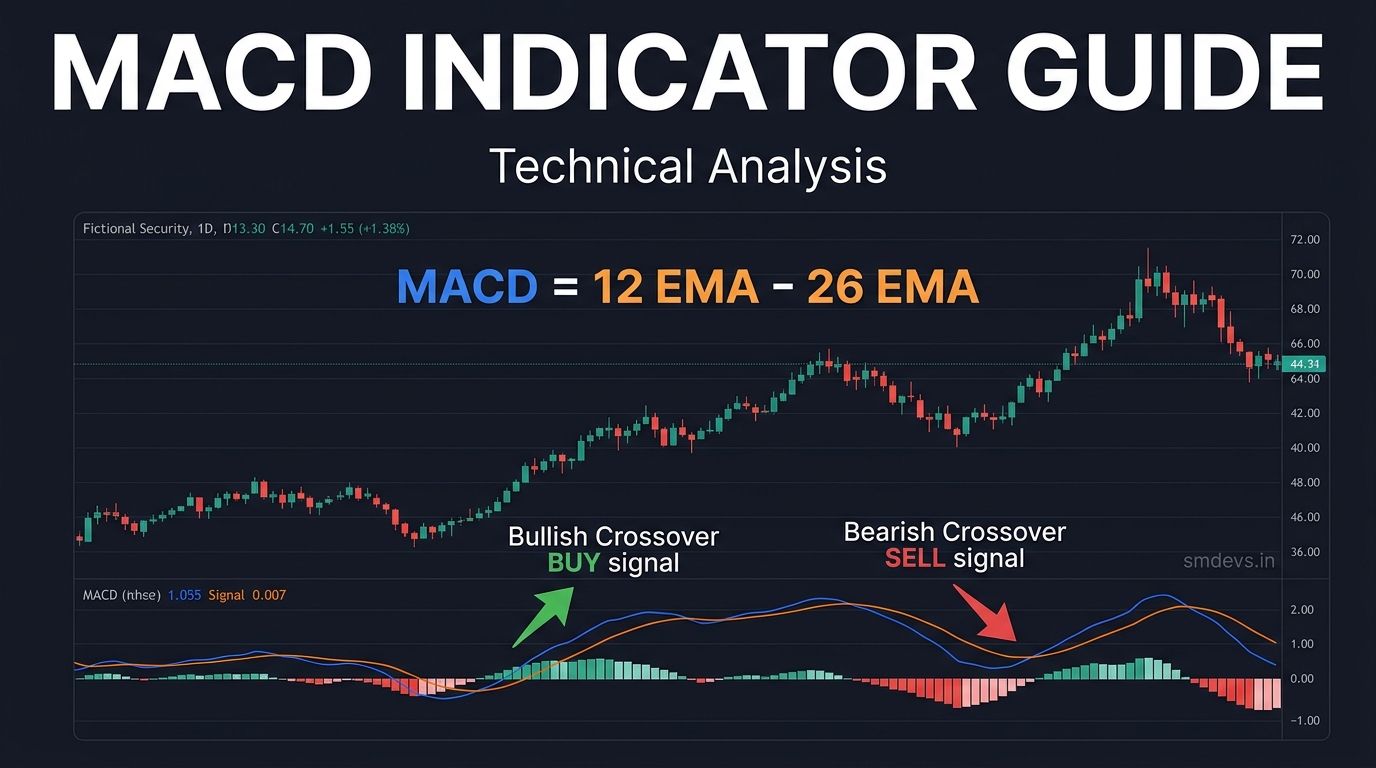
MACD is plotted on a separate panel below the price chart and consists of three components:
- MACD Line: 12-period EMA minus 26-period EMA
- Signal Line: 9-period EMA of the MACD Line
- Histogram: Visual representation of the gap between MACD Line and Signal Line
MACD Formula Explained
MACD Line = 12-day EMA − 26-day EMA
Signal Line = 9-day EMA of MACD Line
Histogram = MACD Line − Signal Line
The standard settings (12, 26, 9) work well for most markets. Day traders sometimes use faster settings (5, 13, 6) while long-term investors may use slower settings (24, 52, 18).
How to Read MACD: The 4 Key Signals
1. MACD Crossover (Primary Signal)
The most common MACD signal is when the MACD Line crosses the Signal Line:
- Bullish Crossover (BUY): MACD Line crosses ABOVE Signal Line → upward momentum building → potential buy opportunity
- Bearish Crossover (SELL): MACD Line crosses BELOW Signal Line → downward momentum building → potential sell/short opportunity
Important: Crossovers work best when the cross happens well below or above the zero line. A crossover near the zero line in a ranging market produces many false signals.
2. Zero Line Crossover
- MACD crosses above zero: 12-EMA has crossed above 26-EMA → trend turned bullish. Strong confirmation of uptrend.
- MACD crosses below zero: 12-EMA has crossed below 26-EMA → trend turned bearish. Strong confirmation of downtrend.
Zero line crossovers are slower signals than line crossovers but more reliable — fewer false signals.
3. Histogram Analysis
The histogram visually shows the strength and momentum of the trend:
- Histogram growing larger (positive): Bullish momentum is strengthening
- Histogram shrinking (positive but decreasing): Bullish momentum is weakening — possible reversal ahead
- Histogram growing larger (negative): Bearish momentum is strengthening
- Histogram shrinking (negative but decreasing): Bearish momentum is weakening — possible reversal ahead
4. Divergence (Most Powerful Signal)
Divergence is when price and MACD move in opposite directions — often a leading indicator of trend reversal:
- Bullish Divergence: Price makes a new lower low, but MACD makes a higher low → bearish trend losing momentum → potential bullish reversal
- Bearish Divergence: Price makes a new higher high, but MACD makes a lower high → bullish trend losing momentum → potential bearish reversal
Key insight: Divergence signals are leading (they appear before the price reversal), making them particularly valuable. However, divergence can persist for a long time before price reverses — always use with other confirmation signals.
MACD Settings for Indian Stock Market
| Trading Style | MACD Settings | Timeframe | Best For |
|---|---|---|---|
| Intraday (day trading) | 5, 13, 6 | 5-min / 15-min charts | Quick momentum trades |
| Swing trading | 12, 26, 9 (standard) | Daily / 4-hour charts | 2–10 day holds |
| Positional trading | 24, 52, 9 | Weekly charts | Weeks to months |
| Long-term investing | 12, 26, 9 on weekly | Weekly / Monthly charts | Timing entries for long-term holds |
MACD Trading Strategy: Step by Step
Strategy 1: MACD Crossover + Trend Filter
- Check the overall trend: Is price above or below the 200-day moving average?
- Only take BUY signals when price is above 200 DMA (uptrend); only SELL signals when below (downtrend)
- Wait for MACD Line to cross above Signal Line (bullish crossover in uptrend)
- Enter on the next candle's open after the crossover
- Stop loss: Below the recent swing low
- Target: 1.5x to 2x the risk amount (1:1.5 or 1:2 risk-reward ratio)
Strategy 2: Divergence + RSI Confirmation
- Identify bullish or bearish MACD divergence on the daily chart
- Confirm with RSI: RSI also showing divergence OR RSI in oversold zone (below 30 for bullish) strengthens the signal
- Wait for price to break above the recent swing high (bullish) or below recent swing low (bearish) as entry confirmation
- This combination produces fewer but higher-quality signals
MACD Limitations and Common Mistakes
- Lagging indicator: MACD is based on moving averages — it reacts to price, not predicts it. By the time a crossover forms, part of the move is already over.
- False signals in ranging markets: MACD generates many false signals when a stock is trading sideways (range-bound). Always identify the trend context before using MACD.
- Don't use MACD alone: Combine with price action, support/resistance levels, volume, and at least one other indicator for confirmation
- Avoid overtrading on every crossover: Not every MACD crossover is a trade. Filter signals by trend context and signal strength
MACD vs RSI: Key Differences
| Feature | MACD | RSI |
|---|---|---|
| Type | Trend + Momentum | Momentum only (oscillator) |
| Range | Unbounded (no fixed range) | Bounded 0–100 |
| Best for | Trend identification, crossover signals | Overbought/oversold conditions |
| Overbought/Oversold | No clear levels (depends on stock) | Above 70 = overbought; below 30 = oversold |
| Used together | Yes — RSI confirms MACD signals; MACD identifies trend for RSI | |
How to Find MACD on Free Platforms
- TradingView: Best charting platform; free plan available. Search any NSE/BSE stock, add MACD indicator from the indicator library.
- Zerodha Kite: Built-in MACD indicator on all chart types
- NSE India website: Basic charts with MACD available under "Chart" for each stock
- Investing.com: Free advanced charts with MACD for Indian indices and stocks
FAQs: MACD Indicator
What is the best MACD setting for Indian stocks?
The standard MACD setting (12, 26, 9) works well for most Indian stocks on the daily timeframe. For swing trading Nifty 50 or Sensex, this standard setting on daily charts is widely used. For intraday trading, consider faster settings like (5, 13, 6) on 15-minute charts.
Is MACD reliable for Nifty 50 trading?
MACD is a useful tool for Nifty 50 analysis, particularly on daily and weekly charts. It works better in trending markets than sideways markets. Many traders use MACD on the weekly Nifty chart to identify the primary trend direction, then use shorter timeframe signals for entry timing.
What does MACD divergence mean?
MACD divergence occurs when price makes a new extreme (new high or new low) but MACD fails to confirm it. Bullish divergence (price lower low + MACD higher low) suggests weakening bearish momentum and possible reversal upward. Bearish divergence (price higher high + MACD lower high) suggests weakening bullish momentum and possible reversal downward.


