Key Takeaways
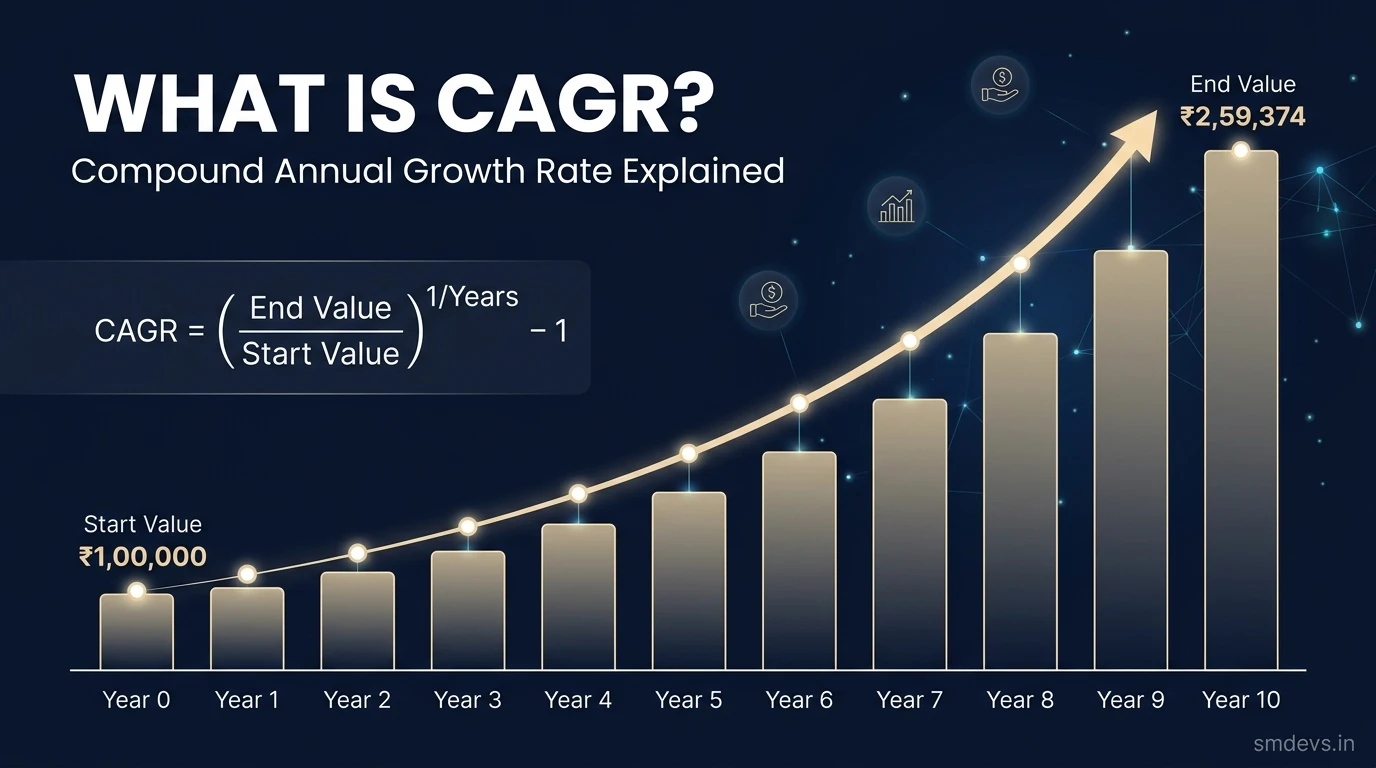
- CAGR = (Ending Value ÷ Beginning Value)^(1÷Years) − 1 — smoothed annual growth rate accounting for compounding
- Always use CAGR to compare investments — simple averages can be misleading when volatility is high
- Rule of 72: Divide 72 by CAGR to find years to double your money (72 ÷ 10% = 7.2 years)
- Nifty 50 CAGR has averaged 12–14% over the last 20 years — the benchmark for equity returns
- For SIP investments, use XIRR not CAGR — XIRR correctly handles multiple cashflows at different dates
CAGR — Compound Annual Growth Rate — is the single most important metric for evaluating investment performance, business growth, and wealth creation over time. Unlike simple average returns, CAGR accounts for the compounding effect — the most powerful force in long-term investing — and provides a single, comparable number that tells you exactly what annual return rate produced a given outcome over a specific period.
Understanding CAGR is essential for every investor, whether you're comparing mutual fund returns, evaluating a stock's earnings growth, or projecting your SIP corpus over 20 years.
What Is CAGR?
CAGR is the smoothed annual rate at which an investment grows from its starting value to its ending value, assuming all profits are reinvested. It represents the hypothetical steady growth rate that would produce the same outcome as the actual (potentially volatile) growth path.
The CAGR formula:
CAGR = (Ending Value ÷ Beginning Value)(1 ÷ Number of Years) − 1
Example: You invest ₹1,00,000. After 5 years it is worth ₹1,61,051.
CAGR = (1,61,051 ÷ 1,00,000)(1÷5) − 1 = (1.61051)0.2 − 1 = 1.10 − 1 = 10% CAGR
This means your investment grew at exactly 10% per year (compounded) — even if the actual annual returns were 15%, −3%, 8%, 22%, and 4% in each respective year. CAGR smooths all volatility into one comparable annual figure.
Key Takeaways
- CAGR is always better than simple average return for evaluating investments. Simple averages can be misleading — a −50% year followed by a +50% year gives a simple average of 0%, but CAGR correctly shows −25% (you've lost money).
- The Rule of 72: Divide 72 by your CAGR to find how many years to double your money. At 10% CAGR, your money doubles in 7.2 years. At 12%, in 6 years.
- Small differences in CAGR compound into enormous differences over long periods. ₹10 lakh at 10% CAGR for 30 years = ₹1.74 crore. At 12% CAGR = ₹2.99 crore. A 2% difference produces ₹1.25 crore more.
- CAGR cannot tell you about volatility. Two investments with identical 15% CAGR can have completely different risk profiles — always look at standard deviation or maximum drawdown alongside CAGR.
- Compare CAGR to a relevant benchmark. A 12% 5-year CAGR sounds good but is mediocre if the Nifty 50 returned 18% in the same period.
CAGR vs. Absolute Return vs. XIRR
| Metric | Formula | Best Used For | Limitation |
|---|---|---|---|
| Absolute Return | (End − Start) ÷ Start × 100 | Point-to-point total gain | Ignores time — 50% return over 2 years vs. 20 years looks the same |
| CAGR | (End÷Start)^(1/Years) − 1 | Lump-sum investment performance comparison | Ignores volatility; assumes single investment at start |
| XIRR | IRR adjusted for irregular cashflows | SIP, regular investments, portfolio with multiple entries/exits | Requires software; more complex calculation |
| Rolling Returns | CAGR recalculated for every possible start date | Assessing consistency of returns across different market cycles | Complex; not available for all investment platforms |
When to use CAGR vs. XIRR:
- Use CAGR when evaluating a lump-sum investment or comparing mutual fund/stock growth rates from a single start point to a single end point.
- Use XIRR when evaluating a SIP (monthly investments of different amounts on different dates) or any portfolio with multiple cashflows. XIRR is the correct metric for SIP return evaluation — not CAGR.
Benchmarks — What Is a Good CAGR?
| Asset Class / Instrument | Historical 10-Year CAGR (India, approx.) |
|---|---|
| Fixed Deposit (bank FD) | 5–7% |
| Gold | 8–10% |
| Nifty 50 Index | 12–14% |
| Large-Cap Mutual Funds | 12–15% |
| Mid-Cap Mutual Funds | 15–20% |
| Small-Cap Mutual Funds | 18–25% (with high volatility) |
| Top Quality Stocks (screened) | 18–30% (individual stock picking, high skill required) |
| Real Estate (metro cities) | 8–12% (plus rental yield) |
As a reference: inflation in India has averaged approximately 5–6% CAGR over the last decade. Any investment returning below inflation CAGR is destroying real wealth, not creating it.
The Compounding Effect — Why Small CAGR Differences Matter Enormously
The most counterintuitive lesson in CAGR is how dramatically small differences in annual return compound over long periods:
| CAGR | ₹1,00,000 after 10 years | ₹1,00,000 after 20 years | ₹1,00,000 after 30 years |
|---|---|---|---|
| 8% | ₹2,15,892 | ₹4,66,096 | ₹10,06,266 |
| 10% | ₹2,59,374 | ₹6,72,750 | ₹17,44,940 |
| 12% | ₹3,10,585 | ₹9,64,629 | ₹29,95,992 |
| 15% | ₹4,04,556 | ₹16,36,654 | ₹66,21,177 |
| 20% | ₹6,19,174 | ₹38,33,760 | ₹2,37,37,631 |
The difference between 10% and 15% CAGR over 30 years is not 50% more money — it is 279% more money. This is the mathematical case for why selecting investments carefully and minimising fees (which directly reduce your effective CAGR) has such an outsized impact on long-term wealth.
How to Calculate CAGR in Practice
Using a calculator: Enter: (Ending Value ÷ Beginning Value), press the yx key, enter (1 ÷ Number of Years), press =, then subtract 1. Multiply by 100 for the percentage.
Using Excel/Google Sheets: =((Ending_Value/Beginning_Value)^(1/Years))-1 — format the result as a percentage.
Using our SIP Calculator: Calculates CAGR-equivalent returns for SIP investments automatically.
Frequently Asked Questions
Is 12% CAGR realistic for long-term Indian equity investors?
Yes — the Nifty 50 index has delivered approximately 12–14% CAGR over the last 20 years. This means a passive index fund investor who stayed invested through multiple market cycles earned this return without any stock-picking skill. Active mutual fund investors in quality large-cap and mid-cap funds have historically earned 13–18% CAGR. However, past performance does not guarantee future returns, and individual results vary significantly based on entry timing, fund selection, and consistency of investment.
What is a good CAGR for a small business?
For small and medium businesses in India, a revenue CAGR of 20–30% is considered strong growth. Net profit CAGR should ideally match or exceed revenue CAGR (expanding margins over time). The Nifty SME IPO index companies have historically grown at 25–40% revenue CAGR before listing. Compare your business CAGR to industry benchmarks — a 15% CAGR in a fast-growing sector may be poor performance, while 10% CAGR in a mature, competitive industry may be excellent.
Can CAGR be negative?
Yes. If your ending value is less than your beginning value (you lost money), the CAGR formula produces a negative number — representing the annualized rate of loss. For example, ₹1,00,000 declining to ₹60,000 over 5 years: CAGR = (0.60)^(0.2) − 1 = −9.6% per year. A negative CAGR over multiple years signals a fundamentally poor investment that is destroying capital at an annualized rate.
Why does mutual fund advertising use CAGR and not total return?
SEBI mandates that Indian mutual funds advertise standardized returns — for investments held more than 1 year, returns must be shown as CAGR (not absolute or simple average). This requirement allows direct comparison between funds across different time periods. It also prevents misleading advertising — a fund that grew 200% over 10 years sounds impressive until you calculate the CAGR of approximately 11.6%, which is below the Nifty 50 benchmark for many periods. Always look at CAGR against a relevant benchmark rather than absolute return figures.
Your Next Step
Use the free SIP Calculator to project how CAGR affects your long-term investment corpus. For the fundamental analysis context around using CAGR to evaluate company earnings growth, see the Fundamental Analysis guide. And for the risk management that protects your compounding from drawdowns, study the Trading Risk Management infographic.


