Key Takeaways
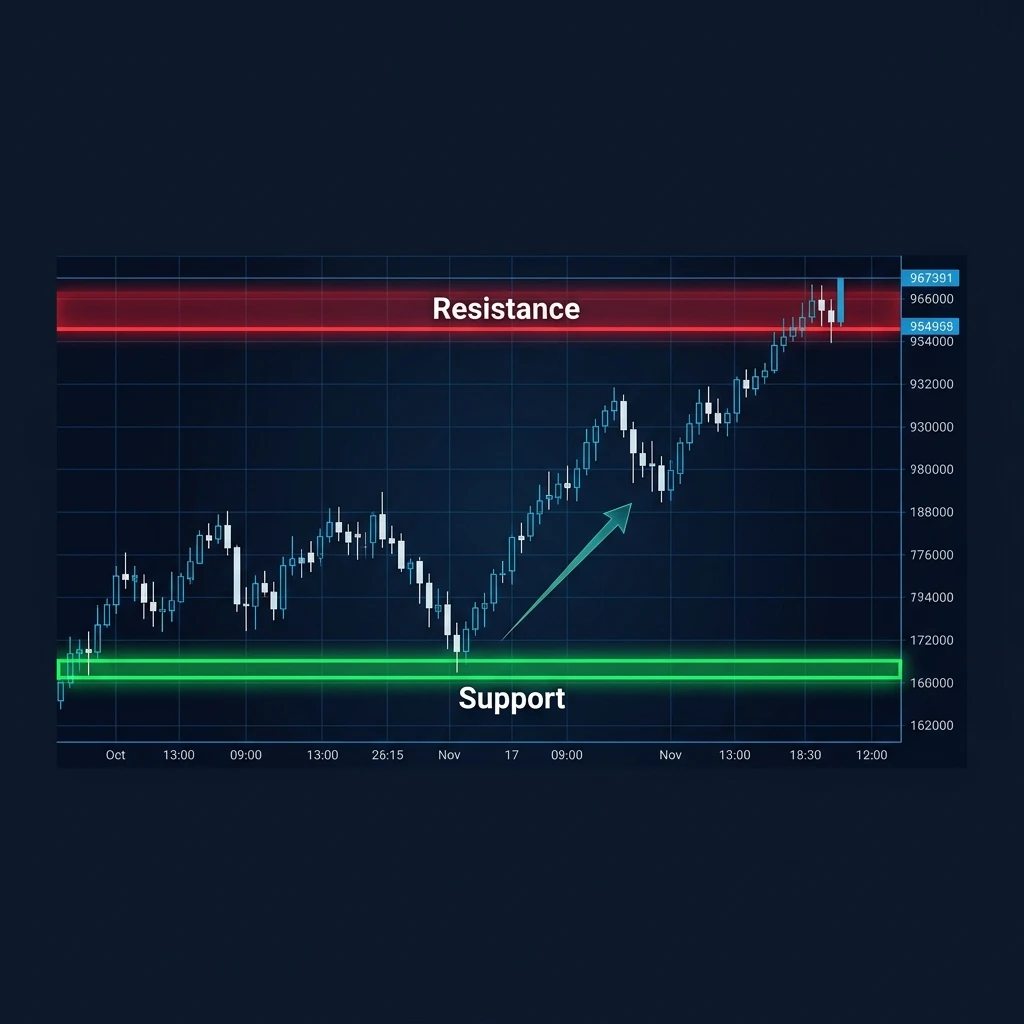
- Support is a price level where buying demand consistently exceeds selling pressure, causing price to bounce higher. Resistance is the opposite — a ceiling where sellers dominate and price is rejected lower.
- These levels form because traders have memory: the same prices where the market reversed in the past attract orders again in the future.
- The most reliable support and resistance levels come from: prior swing highs/lows, round numbers, pivot points, and moving averages.
- Role reversal is one of the most powerful concepts — when support breaks, it becomes resistance, and vice versa.
- Combine support/resistance with pivot points for maximum confluence using our free Pivot Point Calculator.
What Are Support and Resistance in Trading?
Support is a price level at which a downward-moving market consistently finds buying interest strong enough to halt the decline and cause a bounce higher. Think of it as a floor — every time price drops to this level, buyers step in and push it back up.
Resistance is the opposite — a price ceiling where selling pressure consistently exceeds buying, causing price to stall or reverse lower. Every time price rises to this level, sellers step in and push it back down.
These levels are not magic lines — they form because of trader psychology and market memory. The same prices where the market reversed in the past attract new orders in the future: buyers who missed the previous low try to buy at the same price again; sellers who sold at the previous high try to repeat their success.
Why Support and Resistance Work
Three groups of traders create support and resistance levels:
- Buyers who missed the move: Traders who watched a stock bounce from ₹450 and wished they had bought. They wait for price to return to ₹450 and buy again — creating demand at that level.
- Traders in winning positions: Traders who bought at ₹450 and saw the stock rise to ₹520. If price pulls back toward ₹450, they add more to their winning position.
- Traders who were wrong: Traders who sold at ₹450 (thinking it would fall further) and were proven wrong when price rallied. When price returns to ₹450, they exit their losing short to "break even" — creating additional buying pressure at that level.
All three groups buy at the same ₹450 level for different reasons — creating a predictable cluster of demand that acts as support.
How to Identify Support and Resistance Levels
1. Prior Swing Highs and Swing Lows
The most reliable support and resistance levels come from prior swing points — the peaks and troughs that price has previously reversed at. On a daily chart, look for price levels where the market clearly turned around at least twice. The more times a level has been tested and held, the stronger it is.
How to draw them: identify a local low where price bounced up at least twice — draw a horizontal line at that level. That is support. Do the same for swing highs — that is resistance.
2. Round Numbers
Round numbers (Nifty 22,000; 22,500; 23,000; Bank Nifty 48,000; 50,000) act as powerful psychological support and resistance because traders naturally place limit orders and stop losses at round numbers. The clustering of orders at these levels creates self-fulfilling support and resistance zones.
3. Pivot Points (Calculated Support/Resistance)
Pivot points are mathematically calculated support and resistance levels derived from the previous session's high, low, and close. They are extremely popular with intraday traders because they provide objective, pre-calculated levels before the market opens — no subjective drawing required.
The standard pivot levels: PP (central pivot), R1, R2, R3 (resistance), S1, S2, S3 (support). Use our free Pivot Point Calculator to compute today's Nifty and Bank Nifty levels before 9:15 AM each trading day.
4. Moving Averages as Dynamic Support/Resistance
Unlike horizontal support and resistance lines, moving averages are dynamic — they move with price. The 20-day, 50-day, and 200-day EMAs/SMAs act as support in uptrends and resistance in downtrends. The 200-day moving average in particular is watched by institutional traders globally as a major market trend indicator.
Support and Resistance on Nifty 50: Practical Examples
Let us apply these concepts to how intraday traders use support and resistance on Nifty 50:
Scenario — Intraday long setup:
- Calculate today's pivot levels using the Pivot Point Calculator before market opens
- Nifty opens and drops toward S1 at 22,380
- S1 coincides with yesterday's swing low at 22,370 — confluence zone 22,370–22,380
- A bullish hammer candle forms at this zone on the 15-minute chart
- Entry: 22,400 (above the hammer high), Stop: 22,340 (below the support zone), Target: PP at 22,580
- Risk: 60 points, Reward: 180 points → RR = 1:3 ✅
Role Reversal: When Support Becomes Resistance
One of the most powerful concepts in technical analysis is role reversal — when a support level is decisively broken, it flips and becomes resistance. And when resistance is broken, it becomes support.
This happens because of the same trader psychology that creates the levels in the first place:
- Traders who bought at support are now losing when the level breaks. When price rallies back to that same level, they exit their losing longs to cut losses — creating selling pressure at the old support (now resistance).
- Traders who shorted the breakout now have winners. When price retraces to their entry area, they add to positions — creating more selling pressure at the same level.
Role reversal setups are some of the highest-probability trade entries in technical analysis, particularly when the breakout was accompanied by high volume.
Trading Strategies Using Support and Resistance
Strategy 1 — Bounce Trading (Most Common)
Enter in the direction of the prior trend when price reaches a support or resistance level and shows a reversal candlestick pattern. In an uptrend, buy when price pulls back to support. In a downtrend, sell/short when price rallies to resistance.
Entry conditions: price at support/resistance + confirming candle (hammer, engulfing, pin bar) + volume confirmation + additional confluence (pivot point, moving average).
Strategy 2 — Breakout Trading
Enter in the direction of the breakout when price closes convincingly beyond a key resistance (for longs) or support (for shorts). Wait for the candle to close beyond the level — not just spike through it — to avoid false breakouts.
Key filter: strong breakouts are accompanied by volume significantly above the 20-period average. Low-volume breakouts frequently fail and reverse back through the level.
Strategy 3 — Retest Trading (Most Reliable)
After a confirmed breakout, wait for price to pull back and retest the broken level (role reversal) before entering in the breakout direction. This gives you a better entry price and confirmation that the breakout is genuine — failed retests (price bounces off the old resistance, now acting as support) are some of the highest-probability setups in technical analysis.
Support and Resistance Zones, Not Lines
A critical mindset shift: think of support and resistance as zones, not precise lines. Price rarely reverses at the exact same pip or rupee value every time. A support zone might span 30–50 points on Nifty. Within that zone, price may briefly dip below the "line" before reversing.
Drawing support and resistance as zones (shaded rectangles on your chart rather than single lines) prevents you from being stopped out prematurely when price briefly penetrates the level before reversing — which is extremely common and often a liquidity grab by institutional traders before the real move begins.
What is support and resistance in trading?
Support is a price level where buying demand consistently halts a downward price move and causes a bounce higher — acting as a floor. Resistance is a price ceiling where selling pressure consistently stops an upward move and causes a reversal lower. These levels form because traders have memory: the same prices where markets reversed in the past attract clusters of new orders in the future from buyers who missed the move, traders adding to winners, and traders exiting losing positions. The more times a level has been tested and held, the more significant it becomes.
How do you identify support and resistance levels?
Identify support and resistance levels using these methods: (1) Prior swing highs and lows — look for price levels where the market reversed at least twice on a daily or weekly chart; (2) Round numbers — psychological levels like 22,000, 22,500, 23,000 on Nifty attract clusters of orders; (3) Pivot points — mathematically calculated from the prior session's high, low, and close, providing objective daily support and resistance levels; (4) Moving averages — the 20-day, 50-day, and 200-day moving averages act as dynamic support in uptrends and resistance in downtrends. Levels become more significant when multiple methods confirm the same price zone.
What is role reversal in support and resistance?
Role reversal is when a broken support level becomes resistance, and a broken resistance level becomes support. When price breaks below a support level, traders who bought at that support are now losing. If price rallies back to that level, they sell to exit their losing trades — creating selling pressure at the same price that previously attracted buyers. This transforms the old support into resistance. Role reversal retest setups — entering after a breakout as price pulls back to test the broken level — are among the highest-probability trade entries in technical analysis.
What is the difference between support and resistance and pivot points?
Support and resistance from swing highs/lows are identified manually on a chart by looking at where price previously reversed. They are based on historical price action and are somewhat subjective — different traders may draw them slightly differently. Pivot points are mathematically calculated support and resistance levels derived from a formula using the previous session's high, low, and close. They are fully objective — every trader using the same formula gets identical levels. In practice, the most powerful trade setups occur when a pivot point level (calculated support/resistance) aligns with a manual support/resistance level from prior swing points — this confluence significantly increases the probability of a price reaction.


