Key Takeaways
- Position sizing is the process of calculating exactly how many shares, lots, or units to buy or sell
- In a trade based on your account size, your stop-loss distance, and how much of your capital you are willing to risk.
- Most traders focus on picking the right stock or the right entry.
- But it is position sizing that actually determines whether a losing streak destroys your account or merely dents it.
- The formula is simple: Position Size = (Account Balance × Risk %) ÷ Stop-Loss Distance.
- Use the free Position Size Calculator on smdevs.in to get your exact number before every trade in seconds, with zero math.
What Is Position Sizing in Trading?
Imagine you have ₹5,00,000 in your trading account. You spot a great setup on Reliance Industries. You are confident. You go all-in ₹5 lakh worth of stock in one trade.
The stock drops 8% before recovering. You just lost ₹40,000 in a single session on a trade that eventually would have been profitable. Your confidence collapses. You exit at a loss. The trade later hits your exact target.
This scenario which plays out for thousands of Indian traders every day is not a failure of analysis. It is a failure of position sizing.
Position sizing is the discipline of deciding exactly how much capital to put into any single trade. Not based on how confident you feel. Not based on a tip or gut instinct. Based on a mathematical formula that connects your account size, your stop-loss level, and the percentage of your capital you are willing to lose if the trade goes wrong.
Done correctly, position sizing does one critical thing: it guarantees that no single trade can seriously damage your account, no matter how wrong you are.
"The most important skill in trading is not picking stocks. It is surviving long enough to let your edge play out over hundreds of trades." — Van Tharp, Trading Author & Performance Coach
You can have a strategy that is right only 40% of the time and still be profitable if your position sizing is correct. Conversely, you can be right 70% of the time and still blow your account if your position sizes are reckless.
That is how powerful this concept is. And that is why it deserves its own dedicated study before you place another trade.
Why Most Beginners Ignore Position Sizing
Here is an honest observation: most beginner traders treat position sizing as optional.
They spend hours reading about candlestick patterns, RSI crossovers, Fibonacci retracements, and support/resistance levels. They paper trade. They find a setup they believe in. And then, when it comes to actually deciding how many shares to buy , they just pick a number that "feels right."
100 shares. 500 shares. 1 lot. Whatever fits in their budget.
This is the single most common reason new traders lose money, and it happens for a few understandable psychological reasons:
Reason 1: Overconfidence in the setup When you have done your analysis and you are convinced a trade will work, the last thing on your mind is how to limit the damage if it doesn't. Position sizing feels like pessimism. It isn't , it is professionalism.
Reason 2: No framework for deciding Most beginners have never been taught a systematic way to determine trade size. So they default to what's available , the amount of money they have , rather than what's appropriate based on risk.
Reason 3: The illusion of control Buying 500 shares instead of 200 feels like you are being "more committed" to the trade. In reality, you are just being exposed to greater random variance. Markets do not reward commitment. They reward discipline.
Reason 4: Short-term thinking A beginner thinks about one trade at a time. A professional thinks about the next 100 trades as a series. Position sizing only makes logical sense when you think in terms of a long series of trades, not individual outcomes.
The brutal reality is this: you will have losing streaks. Every trader does , including the best ones in the world. The question is whether your losing streak damages your account by 5% or by 50%. Position sizing is the answer to that question.
The Golden Rule: The 1% Risk Rule Explained
Before learning the formula, you need to understand the principle that makes position sizing work.
It is called the 1% Risk Rule, and it is the most widely used risk management principle among professional traders globally.
The rule is simple: Never risk more than 1–2% of your total account balance on any single trade.
This does not mean you put only 1% of your money into the trade. It means that if the trade hits your stop-loss and you exit, your loss should not exceed 1–2% of your total account.
Here is why this number is not arbitrary:
|
Risk Per Trade |
Consecutive Losses to Lose 50% of Account |
|
10% per trade |
7 losing trades |
|
5% per trade |
14 losing trades |
|
2% per trade |
35 losing trades |
|
1% per trade |
70 losing trades |
|
0.5% per trade |
140 losing trades |
Look at the difference. A trader risking 10% per trade can have their account halved in just 7 bad trades in a row. At 1% risk, they would need 70 consecutive losses to reach the same destruction , and almost no strategy produces 70 losses in a row.
This is why even experienced traders with high win rates use the 1% rule. It is not about how little you trust your strategy. It is about building a buffer large enough to survive bad luck while your edge plays out over time.
|
Trader Type |
Recommended Risk Per Trade |
Rationale |
|
Complete Beginner |
0.5% |
Learning phase; preserving capital is the priority |
|
Intermediate Trader |
1% |
Standard professional benchmark |
|
Experienced Trader |
1–2% |
Proven strategy with established track record |
|
Advanced / High Conviction |
2–3% |
Rare; requires exceptional discipline and proven edge |
|
Never |
Above 3% |
Leads to account destruction during inevitable losing streaks |
Position Sizing Formula: How to Calculate It Step by Step
Now the practical part. The position sizing formula has three inputs and one output.
The Formula
Position Size = Risk Amount ÷ Stop-Loss Distance Per Unit
Where:
Risk Amount = Account Balance × Risk Percentage
Stop-Loss Distance = Entry Price − Stop-Loss Price (for a long/buy trade)
Step-by-Step Calculation
Step 1: Decide your risk percentage Most traders use 1%. This is the percentage of your account you are willing to lose if this trade hits your stop-loss.
Step 2: Calculate your Risk Amount (in ₹) Multiply your account balance by your risk percentage.
Step 3: Determine your Stop-Loss Distance This is the gap in rupees (or points) between your planned entry price and your planned stop-loss price.
Step 4: Divide Risk Amount by Stop-Loss Distance The result is the number of shares (or units) you should buy.
Example 1: Equity Stocks (Shares)
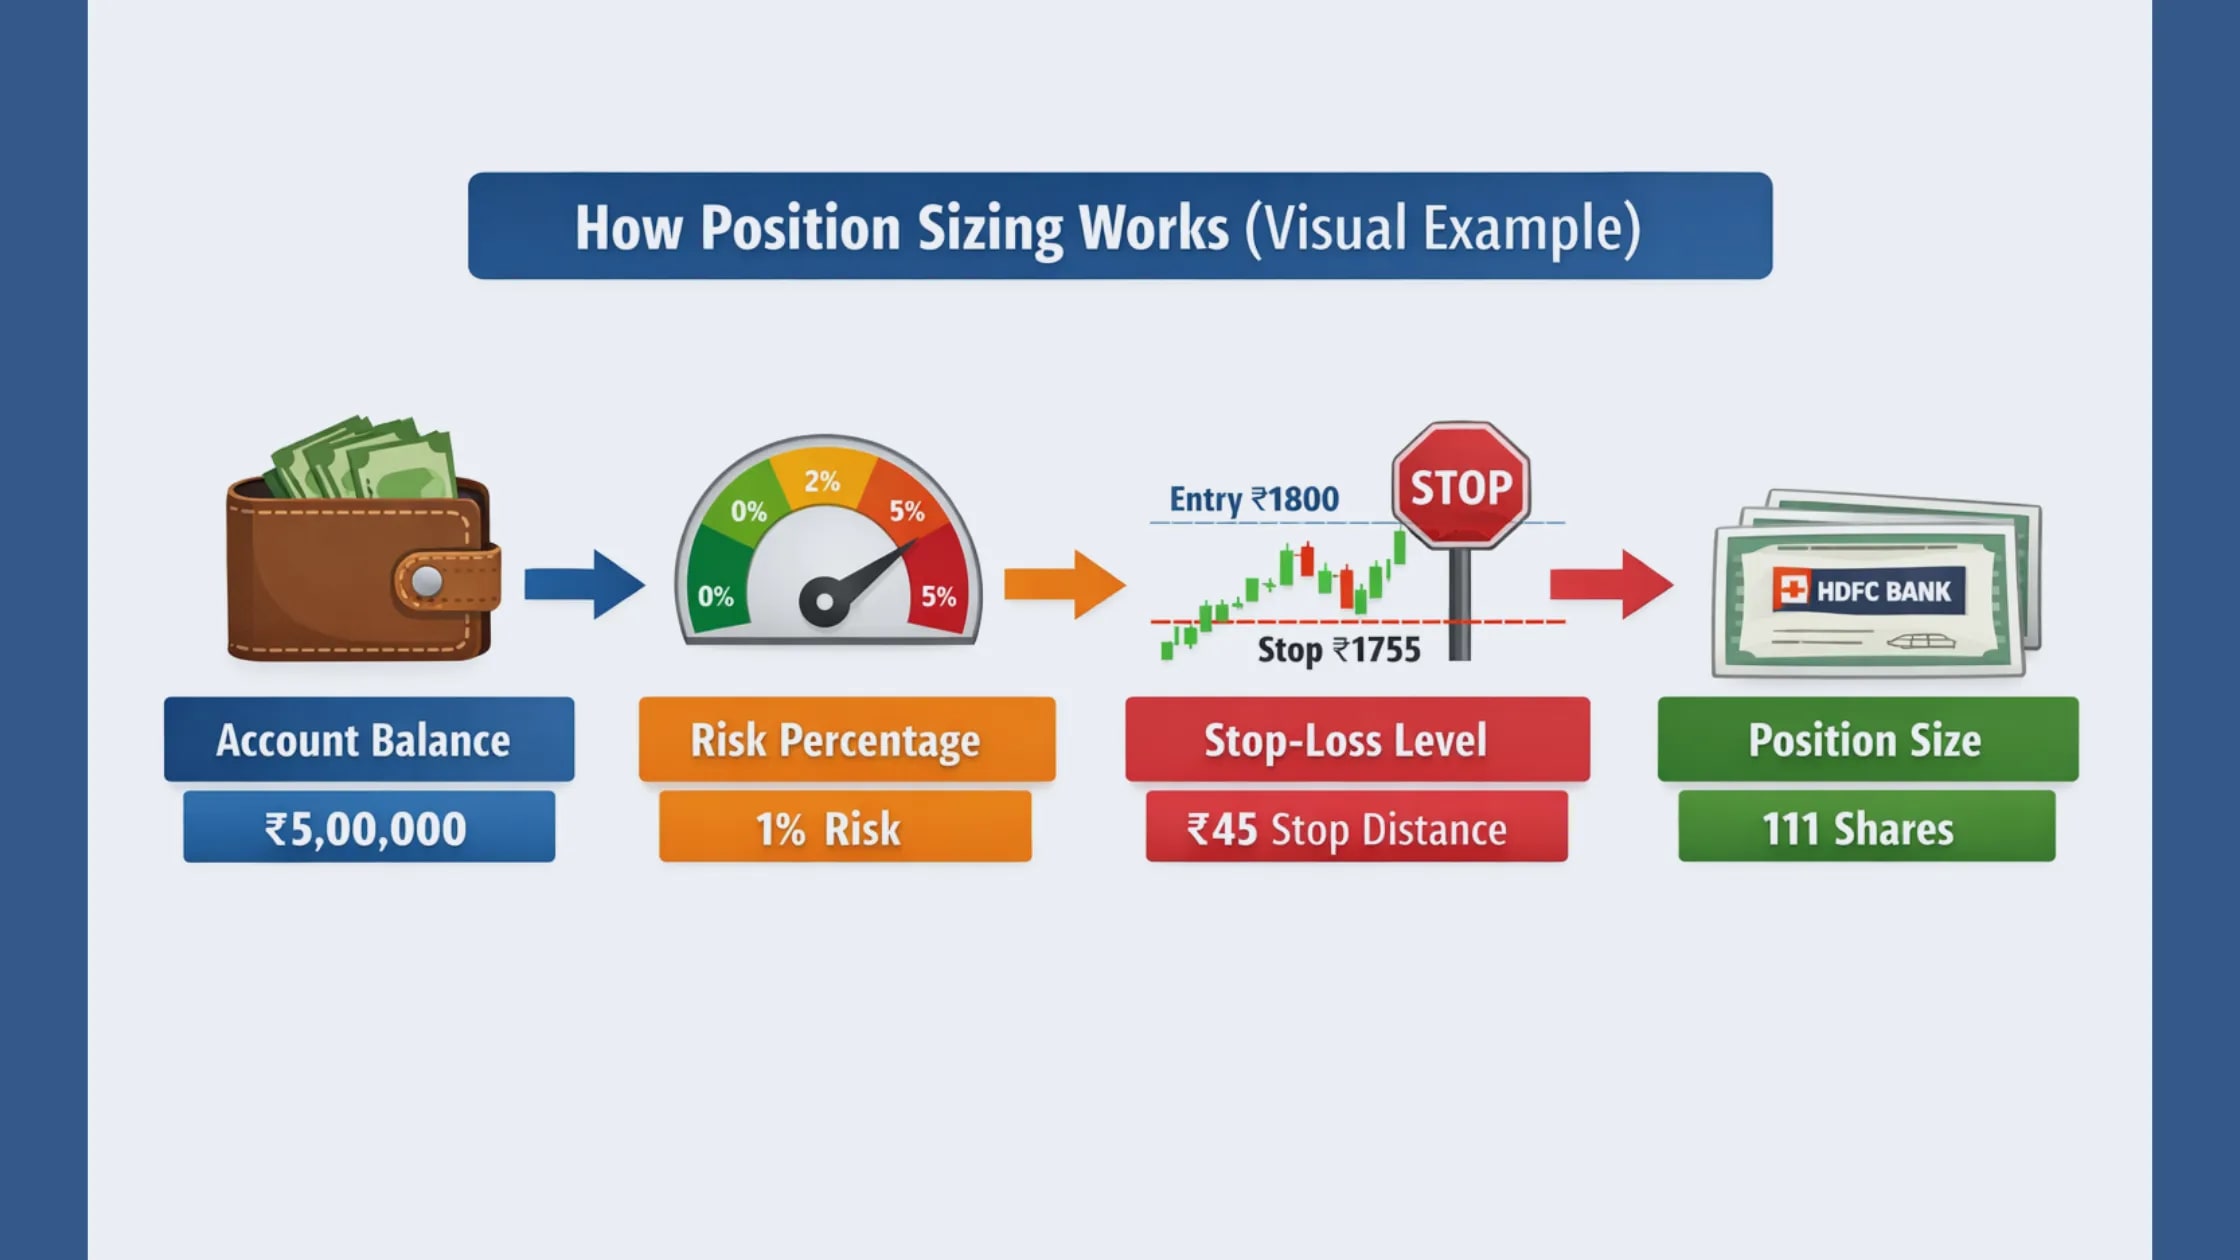
You have a ₹5,00,000 trading account. You want to buy HDFC Bank at ₹1,800. Your stop-loss is at ₹1,755 (the level below which the trade is invalid). You follow the 1% risk rule.
Calculation:
-
Risk Amount = ₹5,00,000 × 1% = ₹5,000
-
Stop-Loss Distance = ₹1,800 − ₹1,755 = ₹45 per share
-
Position Size = ₹5,000 ÷ ₹45 = 111 shares
You should buy approximately 111 shares of HDFC Bank. Not 500, not 200 , exactly 111, because that is the number that limits your worst-case loss to ₹5,000 (1% of your account).
If the trade hits your stop at ₹1,755: Loss = 111 × ₹45 = ₹4,995 , right at your 1% limit. If the trade hits your target at ₹1,890: Gain = 111 × ₹90 = ₹9,990 , a clean 1:2 risk-reward.
Example 2: Intraday Trade
You have a ₹2,00,000 intraday account. You are buying TCS at ₹3,500. Stop-loss: ₹3,460. Risk: 1%.
-
Risk Amount = ₹2,00,000 × 1% = ₹2,000
-
Stop-Loss Distance = ₹3,500 − ₹3,460 = ₹40 per share
-
Position Size = ₹2,000 ÷ ₹40 = 50 shares
No guessing. No gut feeling. Just clean, mathematical discipline.
Position Sizing for Indian Traders: NIFTY, Bank NIFTY & F&O Lots
If you trade F&O (Futures and Options) on NSE, position sizing works slightly differently because you trade in lots , fixed quantities set by SEBI.
Current SEBI-Mandated Lot Sizes (2025)
|
Index / Stock |
Lot Size |
Approximate Margin (1 lot) |
|
NIFTY 50 |
25 shares |
~₹1.2 – 1.5 lakh |
|
Bank NIFTY |
15 shares |
~₹1.0 – 1.2 lakh |
|
Fin NIFTY |
75 shares |
~₹0.5 – 0.7 lakh |
|
Reliance Futures |
250 shares |
~₹1.5 – 2.0 lakh |
|
HDFC Bank Futures |
550 shares |
~₹1.2 – 1.5 lakh |
Lot sizes and margins change quarterly. Always verify on NSE's website before trading.
Calculating Position Size for NIFTY Futures
NIFTY futures move in points, and each point is worth ₹25 (based on the lot size of 25 shares).
Example: Account: ₹10,00,000 Risk: 1% = ₹10,000 NIFTY entry: 23,500 Stop-Loss: 23,450 (50-point stop)
-
Stop-Loss Distance = 50 points
-
Risk Per Lot = 50 points × ₹25 per point = ₹1,250 per lot
-
Number of Lots = ₹10,000 ÷ ₹1,250 = 8 lots
So you would trade 8 lots of NIFTY futures. If the trade stops out at 23,450, your loss = 8 × ₹1,250 = ₹10,000 , exactly 1% of your account.
Bank NIFTY Position Sizing
Bank NIFTY lot size is 15 shares. Each point = ₹15 in value.
Example: Account: ₹5,00,000 Risk: 1% = ₹5,000 Entry: 47,000 | Stop: 46,850 (150-point stop)
-
Risk Per Lot = 150 × ₹15 = ₹2,250 per lot
-
Number of Lots = ₹5,000 ÷ ₹2,250 = 2.2 lots → round down to 2 lots
Always round down when the calculation gives a fraction. Never round up , rounding up means taking more risk than your formula allows.
Important Note: With smaller accounts (below ₹5 lakh), you may find that the correct position size is less than 1 lot. In this case, the trade simply doesn't fit your risk parameters and you should skip it or use options instead to limit your dollar risk. Never trade a lot simply because you have enough margin , respect the position sizing formula.
3 Position Sizing Methods Professionals Actually Use
Beyond the basic 1% rule formula, there are three distinct methods traders use to calculate position size, each with different strengths.
Method 1: Fixed Percentage Risk (Recommended for Most Traders)
This is the method described above , risk a fixed percentage (typically 1–2%) of your current account balance on every trade.
How it works: Position size is recalculated before every trade based on the current account balance. As your account grows from profits, your position sizes automatically grow. As your account shrinks from losses, your sizes automatically shrink , preserving capital during drawdowns.
Best for: All traders at all experience levels. This is the universal standard.
Strength: Self-adjusting , naturally increases size after wins and decreases after losses. Weakness: Requires discipline to recalculate before every trade rather than trading a fixed number of shares.
Method 2: Fixed Dollar Risk
You decide on a fixed rupee or dollar amount to risk per trade , say ₹2,000 , and keep that constant regardless of account balance.
Example: Risk ₹2,000 per trade, always. If your stop is ₹40 away, trade 50 shares. If your stop is ₹20 away, trade 100 shares.
Best for: Traders who want simplicity and prefer thinking in absolute rupees rather than percentages.
Strength: Easy to track total risk across multiple open positions. Weakness: Doesn't self-adjust , if your account doubles, ₹2,000 becomes only 0.5% risk (under-sizing). If your account halves, ₹2,000 becomes 4% risk (dangerous over-sizing).
Method 3: Volatility-Based Sizing (ATR Method)
This advanced method adjusts your position size based on the current volatility of the instrument, measured by the Average True Range (ATR).
The idea: In highly volatile markets (high ATR), you trade smaller. In calm markets (low ATR), you can trade larger. This gives you more consistent rupee-risk across different market conditions.
Formula:
Stop-Loss Distance = ATR × Multiplier (typically 1.5× or 2×)
Position Size = Risk Amount ÷ Stop-Loss Distance
Example: NIFTY ATR is 180 points. Using a 1.5× multiplier, your stop is 270 points away. With ₹10,000 risk and ₹25 per NIFTY point:
-
Risk per lot = 270 × ₹25 = ₹6,750
-
Lots = ₹10,000 ÷ ₹6,750 = 1.48 → 1 lot
Best for: Swing traders and those who trade across multiple markets or timeframes.
Strength: Adapts to actual market conditions; reduces over-sizing in volatile periods. Weakness: Requires understanding of ATR and access to charting tools.
How Risk Reward Ratio and Position Sizing Work Together
Position sizing and risk reward ratio are not separate concepts , they are two halves of the same framework. Understanding how they interact is what separates traders who survive from those who don't.
Here is a concrete example to show how they compound each other:
Scenario: 10 Trades with 50% Win Rate
|
Setting |
Result |
|
Account: ₹5,00,000 |
Risk: 1% = ₹5,000 per trade |
|
Risk:Reward Ratio |
1:2 (risk ₹5,000 to make ₹10,000) |
|
Win Rate |
50% (5 wins, 5 losses out of 10 trades) |
|
Total Profit |
5 × ₹10,000 = ₹50,000 |
|
Total Loss |
5 × ₹5,000 = ₹25,000 |
|
Net Result |
+₹25,000 profit (5% account growth) |
Now see what happens when someone uses the same strategy but trades without position sizing , risking 10% per trade instead of 1%:
|
Setting |
Result |
|
Account: ₹5,00,000 |
Risk: 10% = ₹50,000 per trade |
|
Risk:Reward Ratio |
1:2 |
|
Win Rate |
50% |
|
Total Profit |
5 × ₹1,00,000 = ₹5,00,000 |
|
Total Loss |
5 × ₹50,000 = ₹2,50,000 |
|
Net Result |
+₹2,50,000 , but the worst-case drawdown could have been −₹2,50,000 |
The second trader looks profitable in the end , but during those 5 losing trades, they faced drawdowns that most humans cannot handle emotionally. They would have panic-exited, broken their rules, or blown their account entirely.
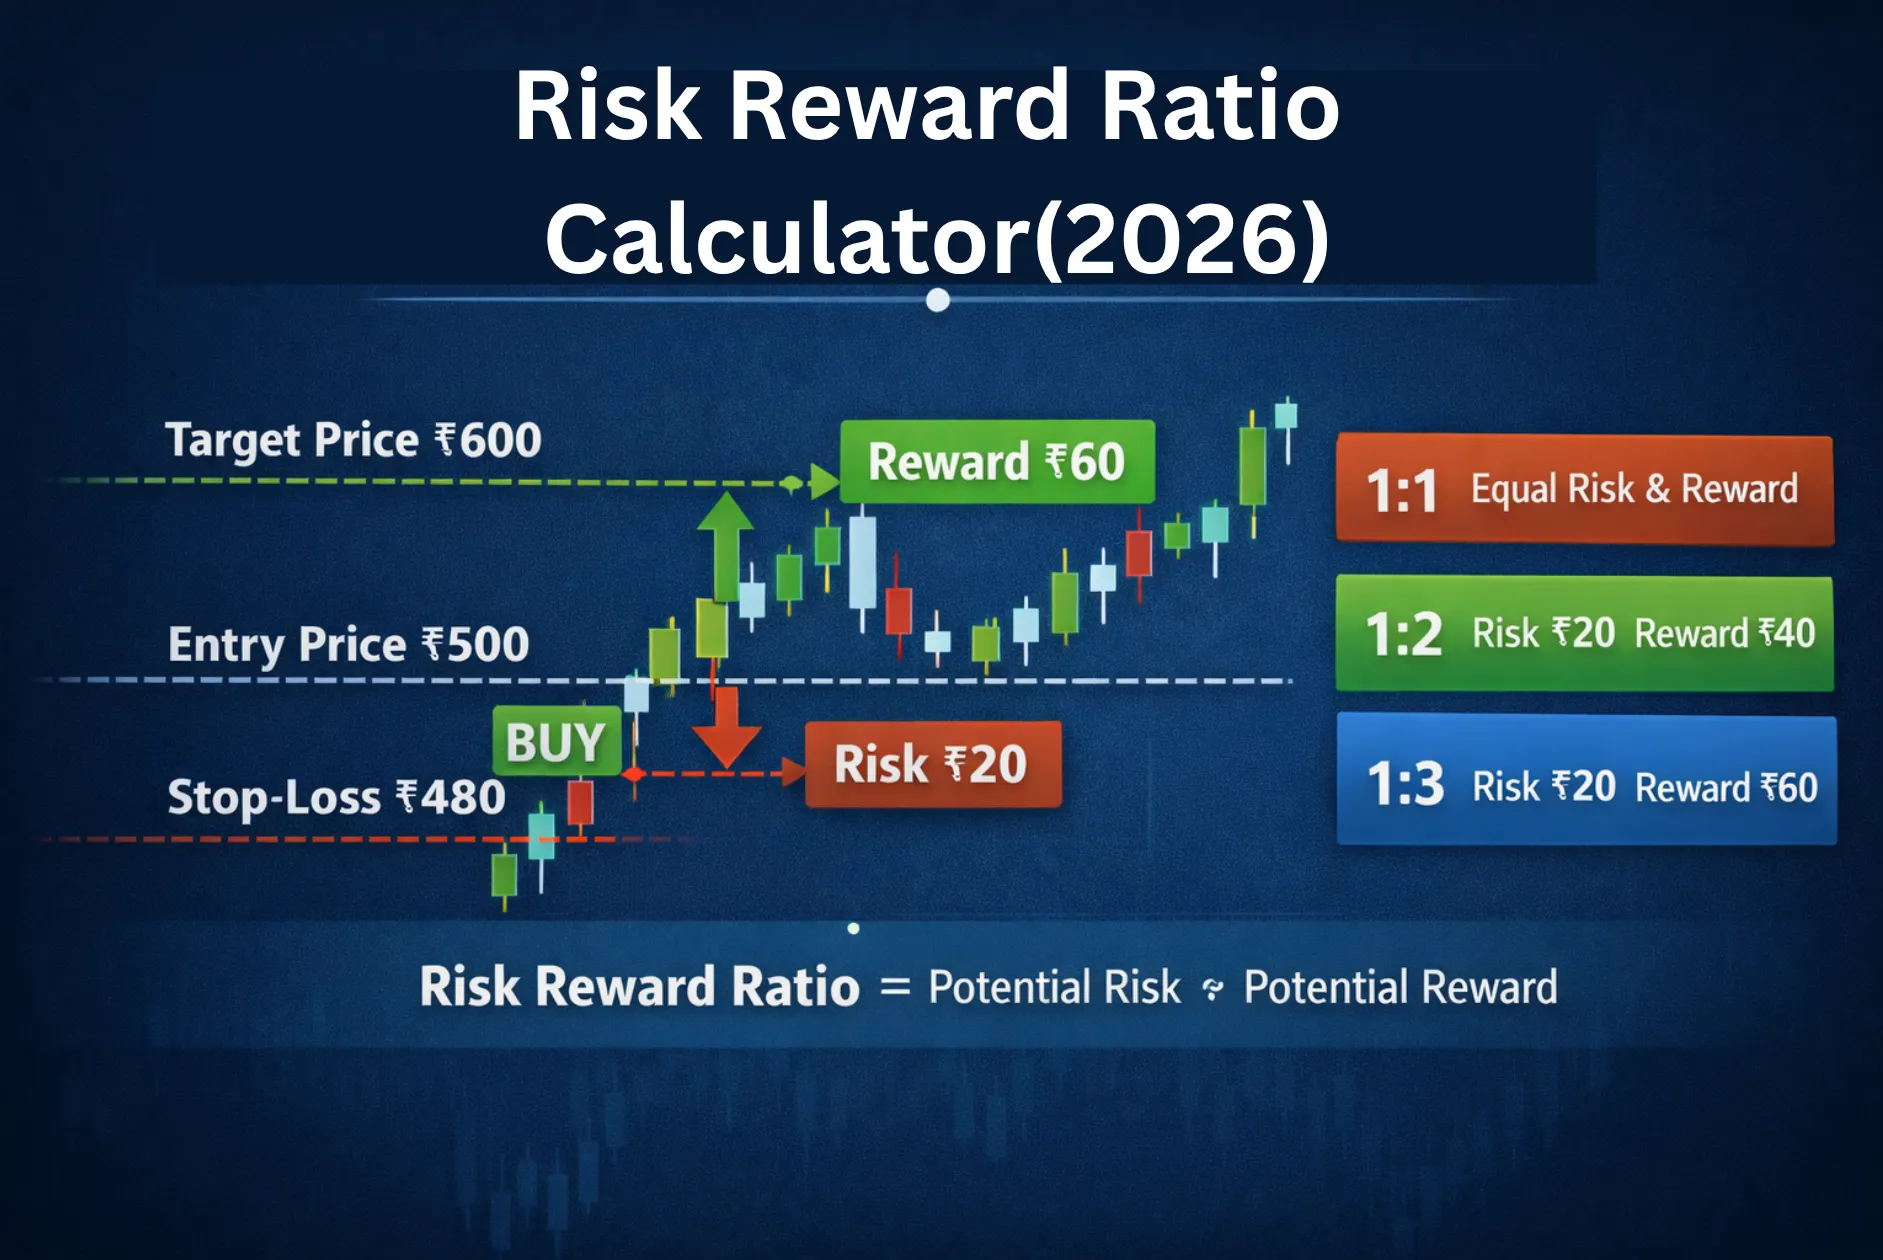
The golden combination: A risk:reward ratio of at least 1:2 + a risk per trade of 1–2% = a system where you can be wrong half the time and still grow your account steadily.
Read the complete guide on Risk Reward Ratio
Position Sizing Across Different Asset Classes
The position sizing formula is universal , it works identically across every market. Only the unit of measurement changes.
|
Asset Class |
Unit of Position |
Stop-Loss Unit |
Example Tool |
|
Equities (Stocks) |
Number of shares |
₹ per share |
smdevs.in Position Sizer |
|
NIFTY / Bank NIFTY Futures |
Number of lots |
Points × Lot size value |
smdevs.in Position Sizer |
|
Forex |
Number of lots (standard/mini/micro) |
Pips |
smdevs.in Position Sizer |
|
Cryptocurrency |
Number of coins / tokens |
₹ or $ per coin |
smdevs.in Position Sizer |
|
Commodities (Gold/MCX) |
Number of lots |
₹ per 10g or per barrel |
smdevs.in Position Sizer |
The formula never changes: Position Size = Risk Amount ÷ Stop-Loss Distance (in the appropriate unit)
What changes is how you measure "distance." For stocks, it's rupees per share. For NIFTY futures, it's points multiplied by the lot's per-point value. For forex, it's pips converted to your account currency. For gold on MCX, it's rupees per 10 grams.
The smdevs.in Position Size Calculator handles all of these automatically , you just enter your numbers, and it outputs the exact position size in the correct unit.
Common Position Sizing Mistakes That Destroy Accounts
Even traders who know the formula make these errors. Being aware of them in advance is the best protection.
Mistake 1: Trading a Fixed Number of Shares Regardless of the Setup Many beginners always buy 100 shares, or always trade 1 lot, regardless of where the stop-loss is. This creates wildly inconsistent risk. A 10-point stop on 1 NIFTY lot risks ₹250. A 200-point stop on 1 NIFTY lot risks ₹5,000. If you always trade "1 lot," your risk changes dramatically between trades without you realising it.
Mistake 2: Not Recalculating After a Losing Streak Your position size should always be based on your current account balance, not the balance you started with. After a drawdown from ₹5,00,000 to ₹4,00,000, your 1% risk should be ₹4,000, not ₹5,000. Many traders stick to old numbers, unknowingly increasing their risk percentage during the period when they can least afford it.
Mistake 3: Increasing Size After a Win to "Make Up" for Previous Losses Revenge trading after losses , and the mirror image, "pressing" after wins , are both violations of position sizing discipline. Each trade is independent. Your size should be determined by the formula alone, not by how your last trade went.
Mistake 4: Ignoring Correlated Positions If you are long on NIFTY futures and also long on Bank NIFTY futures and also long on HDFC Bank shares, you have three positions that are all essentially the same directional bet. If the market falls, all three lose simultaneously. Proper position sizing accounts for correlation , reduce individual position sizes when taking multiple trades that move together.
Mistake 5: Treating the Calculator as Optional Some traders calculate their position size manually for simple trades and skip the calculation for "small" trades. There is no such thing as a trade too small to size correctly. The habit of always calculating before entering is what separates traders who grow accounts from those who leak money through accumulated random sizing.
Mistake 6: Setting a Stop-Loss Based on Position Size Instead of the Chart The stop-loss should always come from technical analysis , a level below support, above resistance, or based on ATR. Once you have the technically correct stop, you use that to calculate your position size. Never do it backwards , never set an arbitrary position size and then set your stop-loss based on how much you are willing to lose.
Position Sizing Cheat Sheet: Quick Reference for Every Trader
Save this and review it before every trading session.
|
Situation |
What To Do |
|
Starting a new trade |
Calculate: Risk Amount ÷ Stop-Loss Distance = Position Size |
|
Account balance changed |
Recalculate your 1% risk amount before the next trade |
|
Stop-loss is very wide (volatile market) |
Reduce position size to keep risk at 1% |
|
Stop-loss is very tight (low volatility) |
Position size will be larger , verify it doesn't exceed margin |
|
Two correlated trades open simultaneously |
Reduce each individual position to 0.5% risk per trade |
|
Calculation gives fractional lots (e.g. 1.7 lots) |
Always round DOWN , never round up |
|
Trade doesn't fit your account size |
Skip the trade or use options to define maximum risk |
|
After a losing streak |
Recalculate risk amount based on current balance |
|
After a winning streak |
Do not increase risk% , just let natural position growth happen |
|
High volatility day (budget, RBI policy, earnings) |
Consider reducing risk per trade to 0.5% |
The position sizing formula to memorise:
Step 1 → Risk Amount (₹) = Account Balance × Risk%
Step 2 → Stop Distance = Entry Price − Stop-Loss Price
Step 3 → Position Size = Risk Amount ÷ Stop Distance
How to Use a Free Position Size Calculator (smdevs.in)
Doing this math before every trade manually is error-prone and slow. That is exactly why the free Position Size Calculator on smdevs exists.
Here is how to use it in under 60 seconds:
Step 1: Go to smdevs.in/tools/trading/position-size , no login, no sign-up required
Step 2: Enter your Account Balance (e.g., ₹5,00,000)
Step 3: Enter your Risk Percentage (e.g., 1%)
Step 4: Enter your Entry Price (e.g., ₹1,800 for HDFC Bank)
Step 5: Enter your Stop-Loss Price (e.g., ₹1,755)
Step 6: Click Calculate , you instantly see:
-
Exact number of shares or lots to trade
-
Total rupee risk on the trade
-
Position value in rupees
-
Risk:Reward summary (if target is entered)
No formula memorisation. No mental arithmetic. No errors. Just the right number, instantly, before every trade.
Other free trading tools on smdevs that pair perfectly with position sizing:
|
Tool |
What It Does |
When to Use |
|
Calculates your R:R ratio based on entry/SL/target |
Before confirming any trade |
|
|
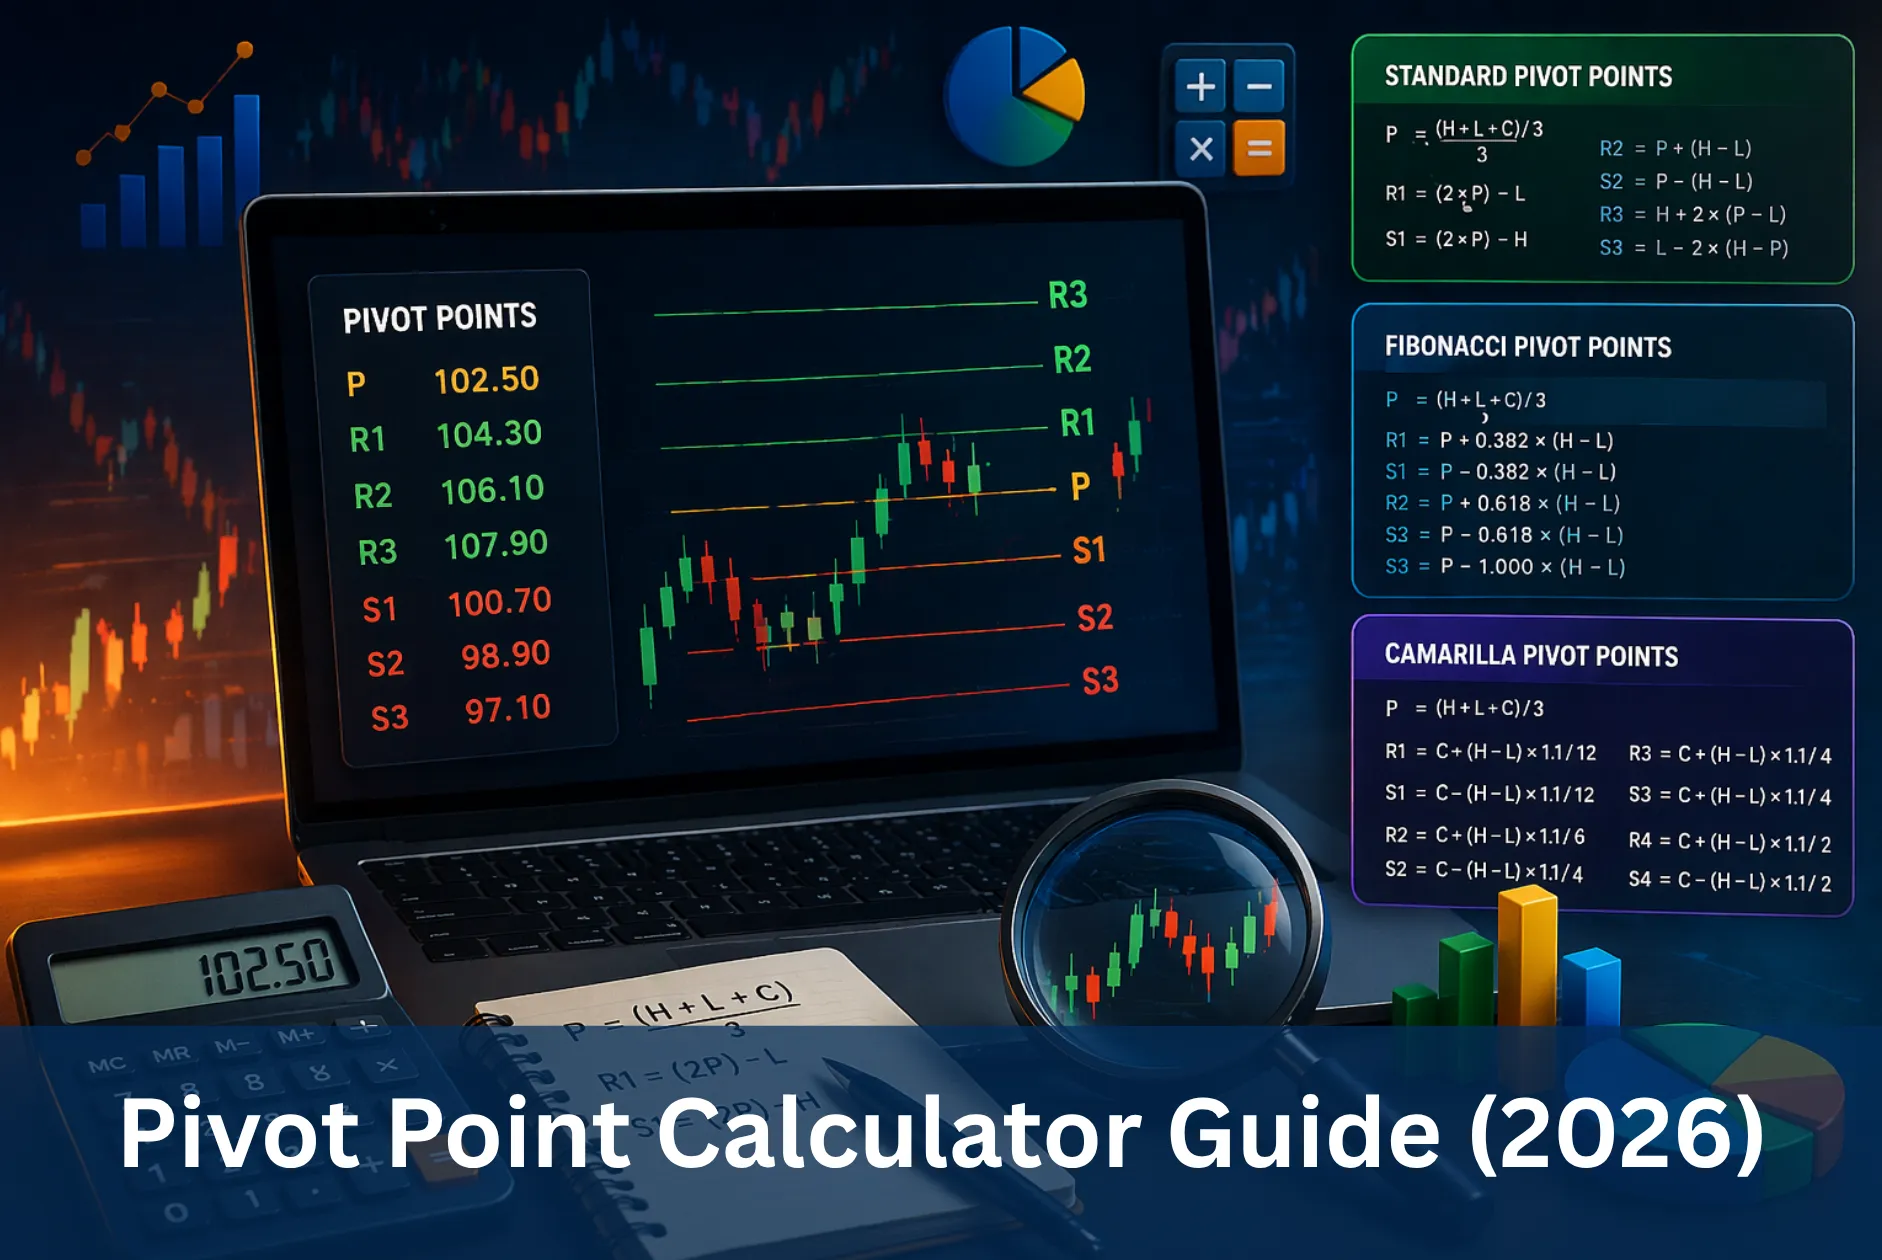
Generates daily support/resistance for stop-loss placement |
Every morning before market open |
|
|
Calculates P&L based on entry, exit, and position size |
After exiting trades |
|
|
Finds the price where your trade covers all costs |
For options and leveraged trades |
Final Thoughts: Size Right, Sleep Right
There is a saying among professional traders: "Your position size is your risk." Not your stop-loss. Not your strategy. Not your market view. Your size.
A trader who sizes correctly can be wrong on 6 out of 10 trades and still grow their account. A trader who sizes recklessly can be right on 8 out of 10 trades and still eventually blow up. The math is unambiguous.
The position size formula is not complicated:
Risk Amount = Account Balance × Risk%
Position Size = Risk Amount ÷ Stop-Loss Distance
But applying it consistently , before every trade, on every market, at every time , requires discipline. It requires treating your trading account like a business, not a lottery ticket.
Start with the 1% rule. Calculate before every trade. Use the free Position Size Calculator at smdevs.in so the math takes seconds, not minutes. And track how your account performs over 20, 30, 50 trades when you stay disciplined about sizing.
You will notice something remarkable: the results become more consistent. The catastrophic losses disappear. The drawdowns become smaller and shorter. And the equity curve , that beautiful line representing your account growing over time , starts to slope in the right direction.
Professionals do not trade to get rich on any single trade. They trade to stay in the game long enough for their edge to compound. Position sizing is what keeps them in the game.
Frequently Asked Questions(FAQs)
What is position sizing in trading?
Position sizing is the process of calculating exactly how many shares, lots, or units to buy or sell in a trade. It is based on three inputs: your total account balance, the percentage of that balance you are willing to risk on a single trade (typically 1–2%), and the distance between your entry price and your stop-loss price. The formula is: Position Size = (Account Balance × Risk %) ÷ Stop-Loss Distance. Correct position sizing ensures that no single losing trade can significantly damage your account.
How do I calculate position size for NIFTY futures?
For NIFTY futures, calculate as follows: multiply your account balance by your risk percentage to get your Risk Amount (e.g., ₹10,00,000 × 1% = ₹10,000). Then calculate the Risk Per Lot by multiplying your stop-loss distance in points by ₹25 (the per-point value of 1 NIFTY lot of 25 shares). Finally, divide your Risk Amount by the Risk Per Lot to get the number of lots. Example: if your stop is 50 points, Risk Per Lot = 50 × ₹25 = ₹1,250. Lots = ₹10,000 ÷ ₹1,250 = 8 lots. Use the free Position Size Calculator at smdevs.in to get this result instantly.
What percentage of my account should I risk per trade?
Most professional traders and risk management experts recommend risking 1% of your total account balance per trade. Beginners should consider starting at 0.5%. Experienced traders with proven strategies may risk up to 2%. Risking more than 3% per trade is generally considered dangerous , even a short losing streak at that level can cause severe damage to your account. The 1% rule allows you to survive 70 consecutive losing trades before losing half your account, giving any solid strategy enough room to demonstrate its edge.
What is the difference between position sizing and stop-loss?
A stop-loss determines at what price you will exit a trade to cut your loss. Position sizing determines how many units to trade so that if the stop-loss is hit, the total loss equals your predetermined risk amount (e.g., 1% of your account). They work together: the stop-loss defines the price exit, and position sizing defines the quantity. Setting a stop-loss without calculating position size is incomplete risk management , you know when to exit but not how much damage that exit will cause.
Can position sizing help even if my trading strategy has a low win rate?
Yes dramatically. Position sizing is what makes low win-rate strategies survivable and profitable. If your strategy wins only 40% of the time but your average win is 3× your average loss (risk:reward of 1:3), you will be profitable over a large number of trades. But only if your position sizing is consistent. Without proper sizing, a losing streak at the wrong time can knock you out of the game before your strategy's statistical edge has a chance to express itself. Position sizing is what gives you the runway to let your edge work.
Disclaimer: This blog is for educational purposes only and does not constitute financial or investment advice. Trading in stocks, futures, and options involves substantial risk of capital loss. Please consult a SEBI-registered investment advisor before making trading decisions. Past performance of any strategy is not indicative of future results.