Key Takeaways
- A moving average smooths price data over a set period to reveal the underlying trend direction, filtering out random daily noise.
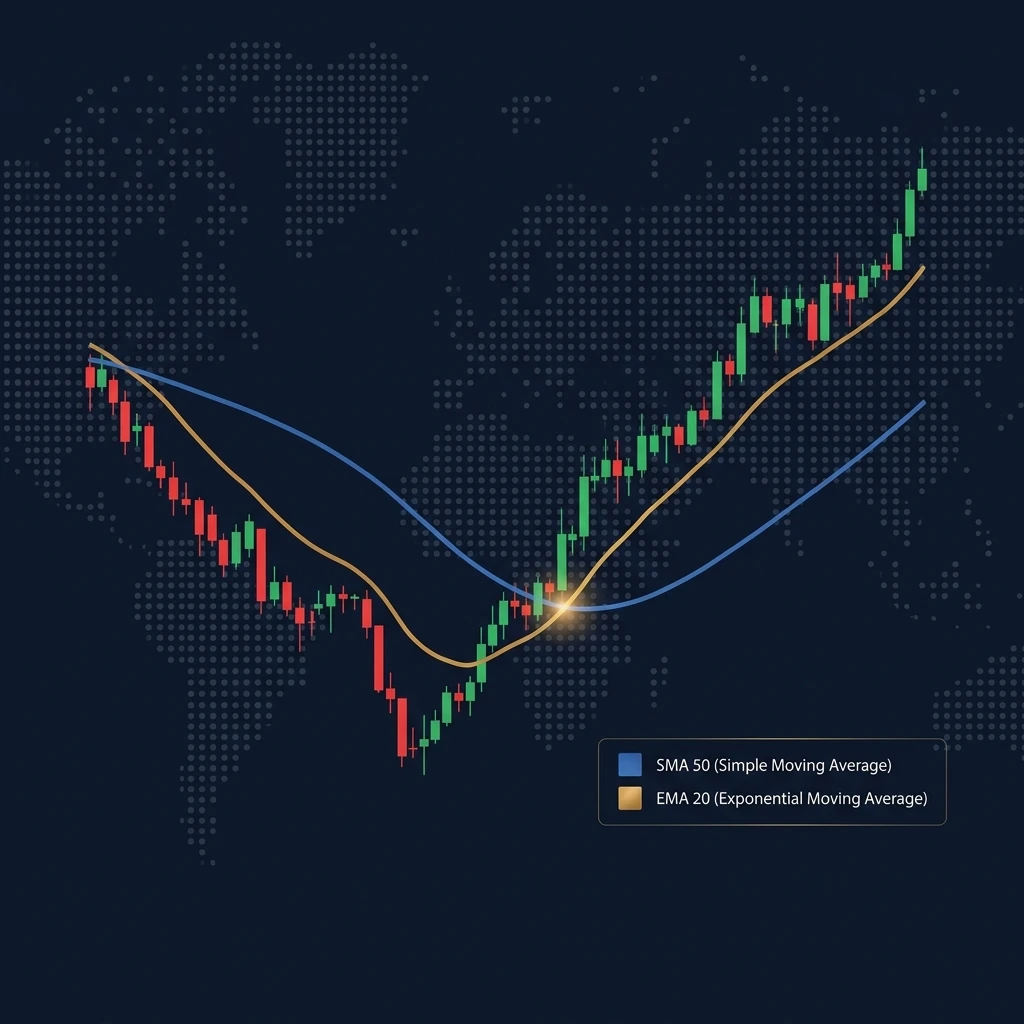
- The Simple Moving Average (SMA) gives equal weight to all periods. The Exponential Moving Average (EMA) gives more weight to recent prices, reacting faster to price changes.
- The most popular settings: 20 EMA for short-term trend, 50 SMA for medium-term trend, 200 SMA for long-term trend and major support/resistance.
- The "Golden Cross" (50 SMA crossing above 200 SMA) and "Death Cross" (50 SMA crossing below 200 SMA) are widely watched institutional signals.
- Moving averages work best in trending markets — they produce many false signals in sideways, choppy conditions.
What Is a Moving Average in Trading?
A moving average is a technical indicator that calculates the average price of a security over a specified number of periods, creating a smooth line on a chart that reveals the underlying trend direction. By averaging out the daily price fluctuations, moving averages help traders see whether price is in an uptrend, downtrend, or sideways consolidation — eliminating the noise that makes raw price charts difficult to interpret.
The word "moving" means the average recalculates each day (or candle) as new data arrives and old data drops off — so it literally moves across the chart as time progresses.
Simple Moving Average (SMA) — Formula and Calculation
The SMA is calculated by adding the closing prices for a set number of periods and dividing by that number:
SMA(n) = (P1 + P2 + P3 + ... + Pn) ÷ n

Example — 5-day SMA for Nifty:
Day 1: 22,100 | Day 2: 22,250 | Day 3: 22,180 | Day 4: 22,400 | Day 5: 22,350
SMA(5) = (22,100 + 22,250 + 22,180 + 22,400 + 22,350) ÷ 5 = 22,256
The SMA gives equal weight to each period in the calculation. The price from 50 days ago has the same influence on the 50-SMA as today's price. This makes the SMA smooth and stable — but slower to react to recent price changes.
Exponential Moving Average (EMA) — How It Differs
The EMA applies a multiplier that gives more weight to recent prices, making it respond faster to current price action than the SMA of the same period length.
EMA Multiplier = 2 ÷ (n + 1)

For 20-period EMA: Multiplier = 2 ÷ (20 + 1) = 0.0952

EMA = (Current Price × Multiplier) + (Previous EMA × (1 − Multiplier))
The practical result: when price makes a sharp move, the 20 EMA will respond noticeably faster than the 20 SMA. The EMA is more sensitive to recent market activity.
SMA vs EMA: Which Should You Use?
| Feature | SMA | EMA |
|---|---|---|
| Price weighting | Equal weight to all periods | More weight to recent prices |
| Reaction speed | Slower — lags more | Faster — less lag |
| False signals | Fewer (smoother) | More in choppy markets |
| Best for | Long-term trend identification, institutional signals (200 SMA) | Short-term momentum, intraday trading, dynamic support |
| Popular settings | 50 SMA, 100 SMA, 200 SMA | 9 EMA, 20 EMA, 50 EMA |
| Used by | Institutional investors, long-term trend traders | Intraday traders, swing traders, momentum traders |
Most experienced traders use a combination — for example, the 20 EMA for dynamic support in an uptrend and the 200 SMA as the major trend line. Neither is universally better; they serve different purposes.
The Most Important Moving Average Settings
20 EMA — The Trader's Moving Average
The 20-period EMA is the most widely used moving average for active traders. In a strong uptrend, price consistently bounces off the 20 EMA on pullbacks, making it an excellent dynamic support level for buying dips. In a downtrend, the 20 EMA acts as resistance on rallies.
Intraday application on 15-minute charts: many intraday traders treat the 20 EMA as the primary trend filter — only taking long trades when price is above the 20 EMA and short trades when below it.
50 SMA — The Swing Trader's Benchmark
The 50-day SMA represents approximately 10 weeks of trading — a medium-term trend indicator. It is one of the most widely watched levels by portfolio managers and institutional traders for identifying medium-term trend changes. A stock consistently above its 50 SMA is considered in a medium-term uptrend; below it, a downtrend.
200 SMA — The Institutional Trend Line
The 200-day SMA is the most important moving average for long-term trend analysis. On a daily chart, the 200 SMA separates bull markets from bear markets. When Nifty 50 is above its 200 SMA, the long-term trend is bullish; below it, bearish. Many institutional fund managers have explicit rules about not holding equity exposure when the index is below its 200 SMA.
The 200 SMA is particularly powerful as a support/resistance level in its own right — markets frequently stage major bounces at the 200 SMA after extended corrections.
The Golden Cross and Death Cross
Two of the most famous moving average signals in all of technical analysis:
Golden Cross
A Golden Cross occurs when the 50-day SMA crosses above the 200-day SMA. It signals that medium-term momentum has shifted bullish and is a widely watched institutional buy signal. Golden Crosses on the Nifty 50 daily chart historically preceded sustained bull runs.
Golden Cross: 50 SMA crosses ABOVE 200 SMA → Bullish signalDeath Cross
The Death Cross is the opposite — when the 50-day SMA crosses below the 200-day SMA. It signals a shift to bearish medium-term momentum and is used by many institutional investors as a signal to reduce equity exposure.
Death Cross: 50 SMA crosses BELOW 200 SMA → Bearish signalImportant caveat: Both signals are lagging — they occur after the trend has already changed. Golden Crosses and Death Crosses are more useful for confirming trend direction than for precise entry timing. Use them as context, not as standalone trade triggers.
Moving Average Trading Strategies
Strategy 1 — 20 EMA Bounce (Trending Markets)
In a confirmed uptrend (price above 50 SMA, above 200 SMA), wait for price to pull back and touch the 20 EMA. When a bullish reversal candle forms at the 20 EMA, enter long with a stop below the 20 EMA (or the most recent swing low). Target the prior high or a resistance level.
This is one of the cleanest and most consistently repeating patterns in trending markets. The 20 EMA bounce is valid on 15-minute (intraday), 1-hour (short swing), and daily (multi-day swing) timeframes.
Strategy 2 — MA Crossover System
Use two moving averages — one faster, one slower. When the fast MA crosses above the slow MA, go long. When it crosses below, go short (or exit). Common pairs: 9 EMA / 21 EMA for intraday, 20 EMA / 50 SMA for swing trades.
Limitation: MA crossover systems produce many whipsaws in ranging markets. Always apply a trend filter — only take crossover signals in the direction of the longer-term trend (e.g., 200 SMA direction).
Strategy 3 — Price Relative to 200 SMA (Trend Filter)
Use the 200 SMA purely as a market regime filter rather than a trade trigger. Only take long setups when price is above the 200 SMA. Only take short setups when price is below the 200 SMA. This single filter dramatically improves the win rate of most trading systems by ensuring you trade in the direction of the dominant long-term trend.
Combining Moving Averages with Pivot Points
The highest-probability setups occur when a moving average aligns with a calculated pivot level — the confluence of two independent support/resistance methods creates a much stronger zone than either alone.
Example: if the daily 50 SMA at 22,380 coincides with the weekly S1 pivot at 22,370, this confluence zone is extremely significant. Calculate your pivot levels each morning with our free Pivot Point Calculator and overlay them on your moving average chart to identify high-confluence trade zones before the market opens.
What is a moving average in trading?
A moving average is a technical indicator that calculates the average price of a security over a specified number of time periods (candles), creating a smooth line on a price chart. It filters out random short-term price noise to reveal the underlying trend direction. As new price data arrives each period, the oldest data point drops off and the average recalculates — hence "moving." Moving averages are among the most widely used technical indicators, serving as dynamic support and resistance levels, trend filters, and crossover signals.
What is the difference between SMA and EMA?
The Simple Moving Average (SMA) gives equal weight to every price period in its calculation — the price from 50 days ago has the same influence as today's price. The Exponential Moving Average (EMA) applies a weighting multiplier that gives more importance to recent prices, making it respond faster to new price action. The result: the EMA reacts more quickly to price changes and is preferred by short-term and intraday traders, while the SMA produces a smoother, more stable line preferred for long-term trend analysis and institutional signals like the 200-day moving average.
What is the Golden Cross in trading?
The Golden Cross is a technical signal that occurs when a security's 50-day Simple Moving Average crosses above its 200-day Simple Moving Average. It indicates that medium-term momentum has shifted bullish and the price trend may be turning upward for the longer term. The Golden Cross is widely watched by institutional investors and fund managers as a bullish confirmation signal. Its opposite — the Death Cross (50 SMA crossing below 200 SMA) — is a bearish signal. Both are lagging indicators that confirm trend changes after they occur rather than predicting them in advance.
Which moving average is best for intraday trading?
For intraday trading, the 20-period EMA is the most widely used moving average. Applied to a 15-minute chart, it provides dynamic support in uptrends and resistance in downtrends, giving intraday traders a reference for trend direction and pullback entries. The 9 EMA is used by very short-term traders for momentum signals. Many intraday traders use a combination — the 9 EMA for momentum direction and the 20 EMA as the primary trend filter, only taking trades in the direction the price is relative to the 20 EMA.
Do moving averages work for Indian stocks and Nifty?
Yes — moving averages are widely used by Indian traders and analysts for Nifty 50, Bank Nifty, and individual stocks on NSE/BSE. The 200-day SMA on the Nifty 50 daily chart is one of the most important technical levels watched by domestic and FII (Foreign Institutional Investor) fund managers for long-term trend assessment. The 20 EMA on 15-minute Nifty charts is a primary reference for intraday traders. Moving averages work on Indian markets the same way they work globally because they are based on price action and trader psychology rather than any market-specific characteristic.


