Key Takeaways
- Moving averages are the most fundamental and widely used technical indicators in trading. They smooth out price data to identify trend direction, act as dynamic support and resistance, and generate bu
What is a Moving Average?
A moving average (MA) is a technical indicator that smooths out price data by calculating an average price over a specified number of periods. It "moves" because it recalculates with each new candle, incorporating the most recent data and dropping the oldest.
Moving averages serve three primary purposes in trading:
- Trend identification: Price above the MA = uptrend; price below = downtrend
- Dynamic support/resistance: In an uptrend, price often bounces off the MA when it pulls back
- Crossover signals: When a faster MA crosses a slower MA, it signals potential trend changes
SMA — Simple Moving Average
The Simple Moving Average (SMA) is the straightforward average of closing prices over N periods:
SMA(20) = (Close₁ + Close₂ + ... + Close₂₀) ÷ 20
Each period is weighted equally. A 200-day SMA adds all 200 closing prices and divides by 200.
Advantages of SMA:
- Easy to understand and calculate
- Less reactive to short-term spikes — smoother line
- Widely watched — many traders see the same signals simultaneously
Disadvantages:
- Lagging — slow to respond to new price action
- Gives equal weight to data from 200 days ago as yesterday's close
EMA — Exponential Moving Average
The Exponential Moving Average (EMA) applies exponentially more weight to recent prices — making it more responsive to new information.
EMA formula: EMA = Price × Multiplier + Previous EMA × (1 − Multiplier)
Where: Multiplier = 2 ÷ (N + 1). For a 20-period EMA: Multiplier = 2 ÷ 21 = 0.0952
Advantages of EMA:
- More responsive — hugs price action more closely
- Catches trend changes faster than SMA
- Better for short-term and intraday trading
Disadvantages:
- More prone to whipsaws (false signals) in choppy markets
- More complex calculation (though all platforms auto-calculate)
SMA vs EMA: Which Should Indian Traders Use?
| Factor | SMA | EMA |
|---|---|---|
| Signal speed | Slower — fewer false signals | Faster — catches moves earlier |
| Best for | Trend identification; positional trading | Momentum trading; intraday |
| Whipsaws | Fewer — more stable | More in choppy markets |
| Used by | Long-term investors, swing traders | Day traders, scalpers, algorithmic traders |
| Most watched levels | SMA 50, SMA 100, SMA 200 | EMA 9, EMA 20, EMA 50 |
Recommendation: For daily chart swing trading on Nifty 50 and stocks — use both. EMA 20 for entry/exit signals and SMA 200 as the long-term trend filter. Only take EMA 20 long signals when price is above SMA 200.
Key Moving Average Levels for Indian Markets
| MA Level | Typical Use | Application |
|---|---|---|
| EMA 9 / EMA 13 | Intraday momentum | 9/13 EMA crossover on 15m chart for Nifty/Bank Nifty |
| EMA 20 / SMA 20 | Short-term trend | Price bounces off 20 EMA in trending stocks |
| EMA 50 / SMA 50 | Medium-term trend | Critical level — price above = intermediate uptrend |
| SMA 100 | Medium-long term | FIIs watch 100 SMA on Nifty daily chart |
| SMA 200 | Long-term trend | The most important MA — market above 200 SMA = bull market |
Nifty 50 and the 200 SMA: Nifty has closed below its 200-day SMA only during genuine bear markets (2008 crisis, COVID crash 2020). When Nifty holds above 200 SMA after a correction, institutional buyers typically step in. This level is watched globally by FIIs.
3 Moving Average Trading Strategies
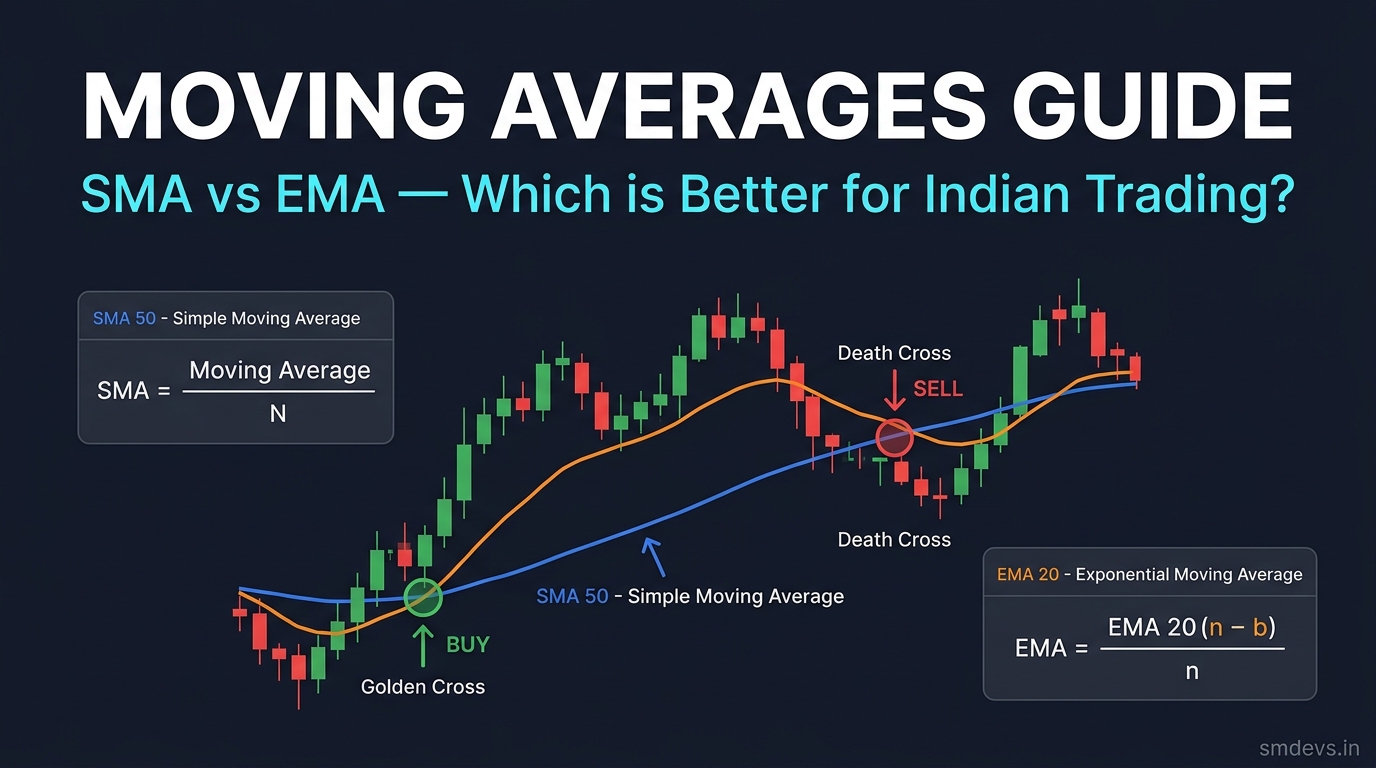
Strategy 1: Golden Cross / Death Cross
The most famous MA signal:
- Golden Cross: SMA 50 crosses ABOVE SMA 200 → Major bullish signal. Historically, Nifty 50 Golden Cross has preceded 12–18 month bull runs. Signal from 2020 (November) preceded the rally from 12,000 to 26,000.
- Death Cross: SMA 50 crosses BELOW SMA 200 → Major bearish signal. Often precedes prolonged downtrends or bear markets.
How to use: Use on the daily chart. The signal lags significantly — by the time the Death Cross confirms, the market has often already fallen 15–20%. Use it as a trend filter, not an entry/exit trigger. Don't short just because of a Death Cross — wait for lower highs and a bounced rejection at the crossed MAs.
Strategy 2: EMA 20 as Dynamic Support (Trend Trading)
In a strong uptrend, price repeatedly pulls back to the 20 EMA and bounces. This is a low-risk entry point:
- Identify stock/index in a clear uptrend (higher highs, higher lows)
- Wait for a pullback toward EMA 20
- Enter long when price bounces off EMA 20 with a bullish candle
- Stop loss: daily close below EMA 20
- Target: new highs or next resistance level
This strategy works particularly well in trending Nifty 50 stocks like HDFC Bank, TCS, and Reliance during bull market phases. Combine with RSI above 50 to confirm trend. Read our RSI Indicator guide for RSI + MA combination strategies.
Strategy 3: Triple MA Crossover (9/21/50 EMA)
Using three EMAs reduces false signals from dual crossovers:
- Setup: EMA 9, EMA 21, EMA 50
- Bullish entry: EMA 9 crosses above EMA 21 AND price is above EMA 50. Enter on the close of the crossover candle.
- Bearish entry: EMA 9 crosses below EMA 21 AND price is below EMA 50. Enter short on close.
- Exit: When EMA 9 crosses back through EMA 21 in the opposite direction
This works well on Nifty 50 15-minute and 1-hour charts for intraday trend trading. The EMA 50 filter eliminates most false crossover signals in choppy conditions.
FAQs: Moving Averages
What is the best moving average for intraday trading in India?
For Nifty 50 and Bank Nifty intraday trading on 15-minute charts: EMA 9 and EMA 21 crossover for momentum signals, with EMA 50 as the trend filter. Many experienced Indian traders also use the 9/13 EMA combo on 5-minute charts for scalping. There's no universally "best" setting — what matters is consistency and using it in the right market conditions (trending vs. ranging).
What is the Golden Cross in stock market?
A Golden Cross occurs when a shorter-term moving average (typically SMA 50) crosses above a longer-term moving average (SMA 200) on a daily chart. It signals that short-term momentum has become stronger than long-term momentum — a bullish trend shift. For the Nifty 50, Golden Cross signals have historically been reliable indicators of medium to long-term bull markets when they occur after a correction.
Which is more accurate, SMA or EMA?
"Accuracy" depends on what you're trying to measure. EMA is better for catching trend changes early and for intraday/short-term trading. SMA is better for identifying the long-term trend direction and for avoiding whipsaws in choppy markets. Most professional traders use both — EMA for entry signals and SMA for trend filters. Neither is universally better; it depends on your timeframe and trading style.


