Key Takeaways
- Position sizing is the #1 factor in long-term trading survival
- Pivot levels provide objective support and resistance without interpretation bias
- A minimum 1:2 risk-reward ratio is required for sustainable profitability
- All four calculators are free and require no signup
- Emotion removed from trading decisions when calculations are automated
The difference between a trader who survives five years and one who blows their account in three months is rarely about which stocks they pick. It is almost always about how they manage risk. Professional traders at every major firm use the same mathematical framework for every single trade: defined position size, calculated pivot levels, quantified risk-reward ratios, and precise P&L tracking. These calculations remove emotion from the equation.
Every one of these calculations is available to retail traders for free—right now, without a subscription. This guide walks through four essential trading calculators, explains the mathematics behind each, and shows you exactly how to integrate them into your trading workflow.
Key Takeaways
- Position sizing is the single most important factor in long-term trading survival—more important than entry or exit timing.
- Pivot levels provide mathematically derived support and resistance levels with zero subjective interpretation.
- A minimum 1:2 risk-reward ratio is the mathematical threshold for sustainable profitability at a 40% win rate.
- Automated P&L calculation eliminates the cognitive biases that cause most retail traders to hold losers too long and cut winners too early.
- All four calculators are available free at SM Developers with no signup or account required.
Why Most Retail Traders Fail (And How Calculators Fix It)
Research consistently shows that approximately 70–80% of retail traders lose money over a 12-month period. The primary culprits are not bad stock picks—they are behavioral and mathematical errors:
- Oversizing positions: Taking trades too large relative to account size, meaning single losses are catastrophic
- Ignoring risk-reward: Taking trades where the potential loss exceeds the potential gain
- Subjective level identification: Drawing support/resistance manually based on what "looks right" rather than objective mathematics
- Emotional exit decisions: Holding losers hoping for a recovery, cutting winners early to "lock in profits"
Trading calculators eliminate all four errors by enforcing mathematical discipline before any trade is executed.
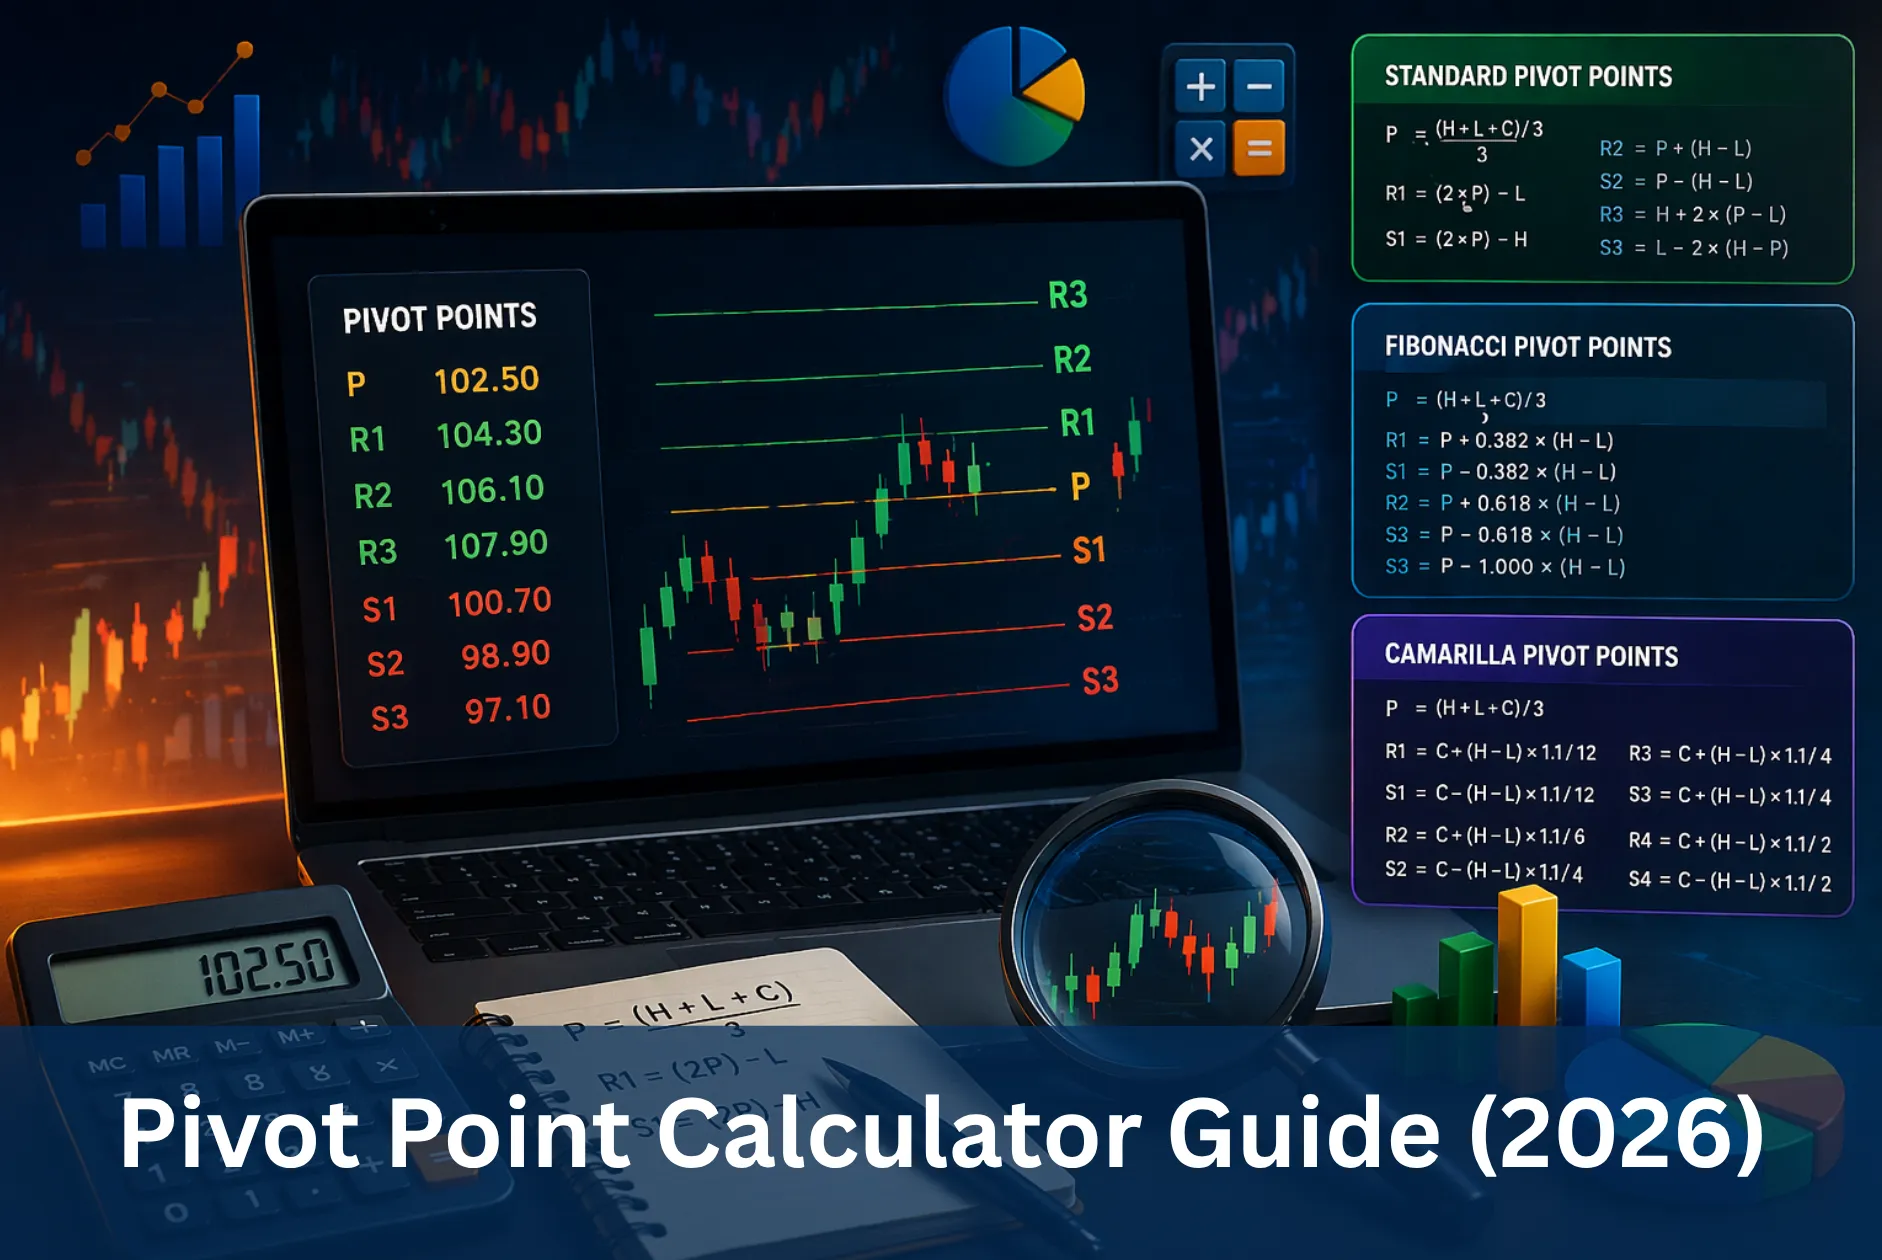
Calculator 1: Pivot Point Calculator
Pivot points are mathematically derived price levels calculated from the previous trading session's high, low, and close. They represent objective support and resistance levels used by institutional traders worldwide—which is precisely what makes them self-fulfilling and reliable.
The Mathematics
Pivot Point (PP) = (Previous High + Previous Low + Previous Close) ÷ 3
Resistance 1 (R1) = (2 × PP) - Previous Low
Resistance 2 (R2) = PP + (Previous High - Previous Low)
Resistance 3 (R3) = Previous High + 2 × (PP - Previous Low)
Support 1 (S1)    = (2 × PP) - Previous High
Support 2 (S2)    = PP - (Previous High - Previous Low)
Support 3 (S3)    = Previous Low - 2 × (Previous High - PP)
How to Use the Pivot Calculator
- Open the Pivot Calculator
- Enter the previous session's High, Low, and Close prices (available from any brokerage or financial data site)
- Select your calculation method: Standard, Fibonacci, Woodie's, Camarilla, or DeMark's
- Note the generated PP, R1, R2, R3, S1, S2, S3 levels
- Mark these levels on your chart before the session opens
Trading application: Look for price reactions at each pivot level. Bounces at S1/S2 are potential long entries. Rejections at R1/R2 are potential short entries. Breaks through R1 or S1 with volume often signal continuation trades to R2/S2 respectively.
Calculator 2: Position Size Calculator
Position sizing answers the most critical question in every trade: How many shares/lots/units should I trade? The answer is never "as many as I can afford." It is always derived from your risk tolerance, account size, and stop-loss placement.
The Mathematics
Risk Amount = Account Size × Risk Per Trade %
Position Size = Risk Amount ÷ (Entry Price - Stop Loss Price)
Example: $50,000 account, 1% risk per trade ($500 risk), entry at $100, stop at $95 (distance = $5). Position size = $500 ÷ $5 = 100 shares. This means a loss on this trade is exactly $500 regardless of your opinion about the stock.
How to Use the Position Size Calculator
- Open the Position Size Calculator
- Enter your account size, risk percentage (typically 0.5%–2% per trade), entry price, and stop-loss price
- The calculator returns the exact number of units to trade
- Never deviate from this number based on "confidence" in the trade—all trades carry equal uncertainty
Professional standard: Most institutional traders risk 0.5%–1% per trade. Risk above 2% per trade makes account recovery from losing streaks mathematically difficult. A 10-trade losing streak at 2% risk per trade draws down an account by 18.3%. The same streak at 5% per trade draws down by 40.1%.
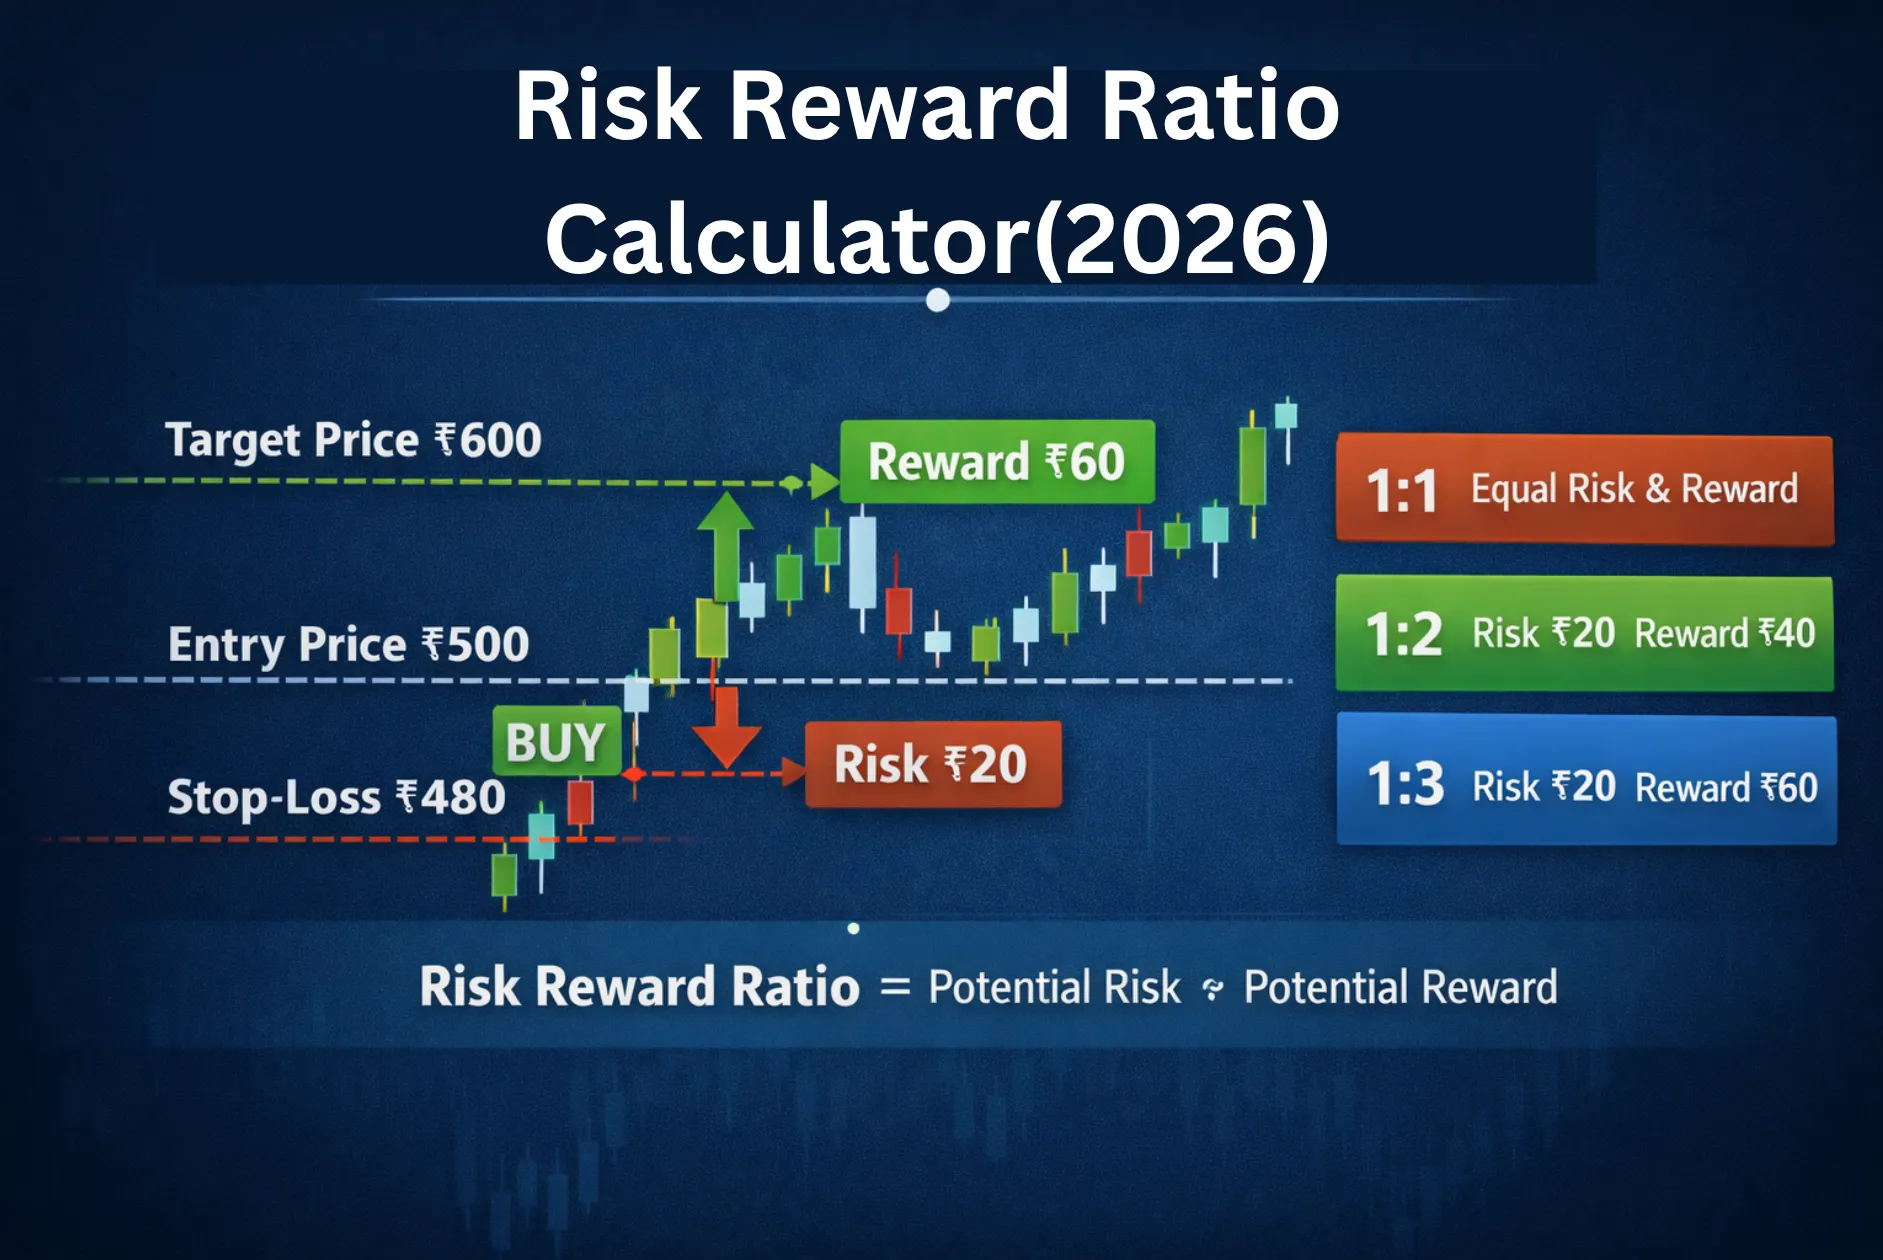
Calculator 3: Risk-Reward Calculator
The risk-reward ratio determines whether a trade setup is mathematically worth taking. A trade with poor risk-reward is unprofitable even with a high win rate. A trade with excellent risk-reward can be profitable with a surprisingly low win rate.
The Mathematics
Risk = Entry Price - Stop Loss Price
Reward = Target Price - Entry Price
Risk-Reward Ratio = Reward ÷ Risk

Breakeven Win Rate = 1 ÷ (1 + Risk-Reward Ratio)
A 1:2 risk-reward means you need to win only 34% of trades to break even. A 1:3 ratio requires only 25% win rate for profitability. This is why professional traders prefer high risk-reward setups even with lower win rates.
Minimum Acceptable Risk-Reward by Win Rate
| Your Win Rate | Minimum R:R Required to Be Profitable |
|---|---|
| 60% | 1:0.7 or better |
| 50% | 1:1 or better |
| 40% | 1:1.5 or better |
| 33% | 1:2 or better |
| 25% | 1:3 or better |
Use the Risk-Reward Calculator to evaluate any trade setup before entry. If the ratio does not meet your minimum threshold, skip the trade.
Calculator 4: Profit and Loss Calculator
The P&L Calculator computes exact profit or loss for any trade across different exit scenarios. This is critical for two reasons: pre-trade planning (evaluating whether a potential profit justifies the risk) and post-trade analysis (understanding the mathematical reality of your outcomes).
How to Use the P&L Calculator
- Open the P&L Calculator
- Enter your entry price, position size (units), and target exit prices
- The calculator shows exact P&L at each exit scenario, net of brokerage charges if entered
- Use multiple target scenarios (T1, T2, T3) to plan partial profit-booking strategies
Building a Calculator-Integrated Trading Workflow
The power of these calculators is compounded when used in sequence before every trade:
- Before the session: Run the Pivot Calculator with yesterday's OHLC data. Mark all levels on your chart.
- When a setup appears: Identify your entry, stop-loss (usually below the nearest pivot level or technical structure), and target (the next pivot level or resistance).
- Evaluate the setup: Run the Risk-Reward Calculator. If the ratio is below your minimum, skip the trade.
- Size the position: Run the Position Size Calculator to determine exact unit count.
- Model the outcome: Run the P&L Calculator to see exact dollar outcomes at your target and stop-loss levels.
- Execute only if all criteria are met.
This workflow transforms trading from a gut-feeling exercise into a repeatable, measurable process—which is the foundation of every professional trading operation.
Frequently Asked Questions
What percentage of my account should I risk per trade?
Most professional traders recommend 0.5%–2% per trade. Beginners should start at 0.5%–1% to develop discipline while limiting catastrophic drawdowns. Above 2% per trade, a normal losing streak of 10 consecutive losses becomes psychologically and financially devastating.
Are pivot levels reliable for Indian markets (NSE/BSE)?
Yes. Pivot levels are used by institutional traders globally, including in Indian equity markets. The most widely used calculation methods for Indian markets are Standard Pivots and Camarilla Pivots. Both are available in the SM Developers Pivot Calculator.
Do these calculators work for cryptocurrency trading?
Yes, all four calculators work for any tradeable asset: stocks, F&O, forex, commodities, and cryptocurrency. Simply use the asset's price data for pivot calculations and the same risk principles apply universally.
How often should pivot levels be recalculated?
Daily pivots are recalculated every session using the previous day's OHLC. Weekly pivots use the previous week's data and are recalculated every Monday. For intraday traders, daily pivots are most relevant. For swing traders, weekly pivots provide better context.
Start Trading With Mathematical Discipline
Professional trading is not about predicting markets—it is about managing risk so precisely that profitability becomes a mathematical inevitability over a large enough sample of trades. These four calculators give you the same mathematical framework used by professional trading desks.