Key Takeaways
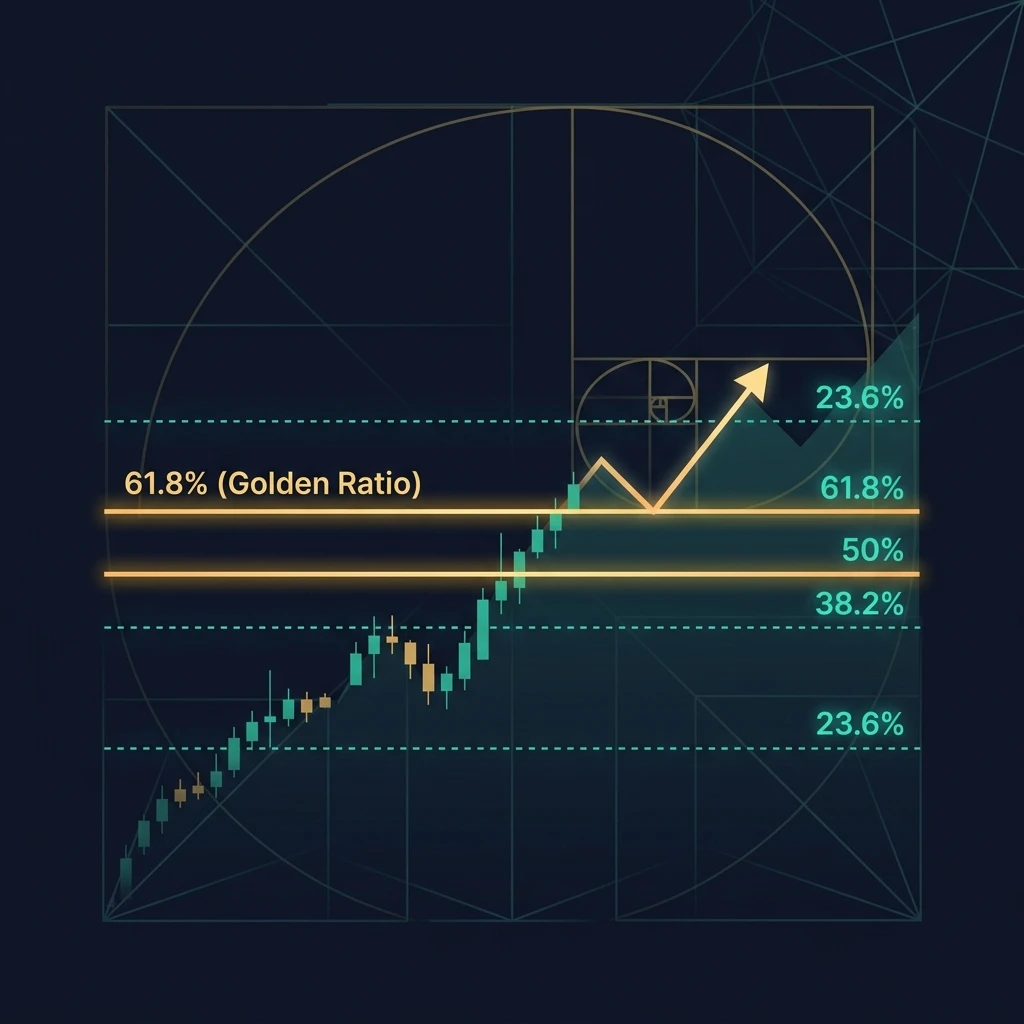
- Fibonacci retracement levels are horizontal price levels — at 23.6%, 38.2%, 50%, 61.8%, and 78.6% — that indicate where a pullback in a trending market may find support or resistance.
- The 61.8% level (the "Golden Ratio") is the most significant and most respected Fibonacci level across all markets and timeframes.
- Never trade Fibonacci levels in isolation — wait for confirmation: a reversal candlestick pattern, volume spike, or confluence with a pivot point or moving average.
- The 50% level is not a true Fibonacci number but is widely used because markets frequently retrace exactly half of a prior move before continuing.
- Fibonacci retracement is most reliable in clearly trending markets — it loses accuracy in sideways, choppy conditions.
What Is Fibonacci Retracement?
Fibonacci retracement is a technical analysis tool that identifies potential support and resistance levels during a pullback within an existing trend. It is based on the Fibonacci sequence — a mathematical pattern where each number is the sum of the two preceding numbers (1, 1, 2, 3, 5, 8, 13, 21, 34...) — and the ratios derived from it.
When a market (a stock, index, or currency pair) makes a strong directional move and then begins to retrace, traders use Fibonacci levels to anticipate where the pullback is likely to pause or reverse before the original trend resumes. These levels act as alert zones — price areas where the probability of a reversal is higher than at random points on the chart.
The Key Fibonacci Retracement Levels
The standard Fibonacci retracement levels and their significance:
| Level | Fibonacci Basis | Trading Significance |
|---|---|---|
| 23.6% | Derived from Fibonacci ratios | Shallow retracement — seen in very strong trends. Often only a brief pause before continuation. |
| 38.2% | 1 ÷ 2.618 | Moderate retracement — common in stocks with strong momentum. Good entry in strong uptrends. |
| 50.0% | Not a true Fibonacci ratio | Widely watched — half the prior move. Markets frequently reverse at exactly this level. |
| 61.8% | The Golden Ratio (1 ÷ 1.618) | Most significant level. Called the "Golden Ratio" — the most reliable Fibonacci level across markets. |
| 78.6% | Square root of 61.8% | Deep retracement — last line of defence before the prior swing is invalidated. |
The Golden Ratio: Why 61.8% Matters Most
The 61.8% level — known as the Golden Ratio or "phi" (φ) — appears throughout nature, architecture, and financial markets. It is derived from dividing any Fibonacci number by the next one in the sequence: 34 ÷ 55 = 0.618, 55 ÷ 89 = 0.618, and so on.
In trading, the 61.8% retracement is the most watched level because it represents the point where a pullback starts to challenge the original trend's validity. A bounce from 61.8% confirms the trend remains intact. A break below it (in an uptrend) suggests the move may be a reversal rather than a temporary pullback.
Professional and institutional traders pay close attention to the 61.8% level, which creates a self-fulfilling element — the more traders watch a level, the more likely it is to become a turning point as orders cluster there.
How to Draw Fibonacci Retracement Correctly
Drawing Fibonacci retracement levels incorrectly is the most common mistake beginners make. The key is identifying the correct swing high and swing low for the move you want to analyse.
In an Uptrend (Finding Support)
- Identify a clear, significant swing low (the bottom of the move you want to measure)
- Identify the corresponding swing high (the top of the move)
- Draw the Fibonacci tool from the swing low to the swing high (bottom to top)
- The horizontal levels (23.6%, 38.2%, 50%, 61.8%) will appear between the two points — these are your potential support zones during the pullback
In a Downtrend (Finding Resistance)
- Identify the swing high (the top of the downward move)
- Identify the swing low (the bottom of the downward move)
- Draw from the swing high to the swing low (top to bottom)
- The levels will appear above the current price — these are potential resistance zones during any rally
Common mistake to avoid: Don't draw Fibonacci on every minor wiggle in the chart. Use significant swing points that represent a meaningful directional move — ideally a move that took place over at least 5–10 candles on your timeframe.
Fibonacci Retracement Trading Strategy: The Confluence Method
Fibonacci levels alone are not enough to place a trade. The most reliable Fibonacci setups occur when a Fibonacci level aligns with one or more other technical signals — this is called confluence. The more confirming factors at a price level, the higher the probability of a reversal there.
What to Combine with Fibonacci Levels
- Pivot Points: When a Fibonacci level coincides with a daily pivot point (PP, S1, S2, R1, R2), the zone becomes significantly stronger. Use our free Pivot Point Calculator to compute today's levels before the market opens.
- Moving Averages: A 50-day or 200-day moving average crossing near the 61.8% Fibonacci level creates extremely powerful support/resistance.
- Prior support/resistance: When an old support level aligns with a Fibonacci retracement, it confirms the area as significant.
- Volume spikes: High volume at a Fibonacci level indicates institutional participation, strengthening the setup.
Entry Criteria for a Fibonacci Trade
- Identify the trending market — Fibonacci works best with a clear prior move
- Draw Fibonacci from the correct swing points
- Wait for price to reach a key level (38.2%, 50%, or 61.8%)
- Look for a confirming reversal signal: hammer, bullish engulfing, doji, or pin bar candle
- Check for confluence with another technical level
- Enter at the confirmation candle's close or next candle open
- Place stop-loss just below the next Fibonacci level (e.g., if entering at 61.8%, stop below 78.6%)
- Target: the prior swing high (in an uptrend) or the 0% Fibonacci level
Stop-Loss Placement with Fibonacci Levels
One of Fibonacci's most practical uses is for structuring stop-losses. If you enter at the 61.8% retracement level, your stop-loss goes just below the 78.6% level — this is a logical, technically justified stop rather than an arbitrary round number.
| Entry at Fibonacci Level | Stop-Loss Placement | Invalidation Point |
|---|---|---|
| 38.2% | Just below 50% | Break of 61.8% |
| 50.0% | Just below 61.8% | Break of 78.6% |
| 61.8% | Just below 78.6% | Break below swing low |
Use our Risk/Reward Calculator after determining your entry and stop-loss to verify the trade meets at least a 1:1.5 RR before placing the order.
Fibonacci Retracement on Nifty 50 (Practical Example)
Fibonacci retracement is widely used by Indian traders for Nifty 50 and Bank Nifty analysis. Here is how to apply it to a real scenario:
Scenario: Nifty 50 makes a swing low at 21,800 and rallies to a swing high at 23,200 (a 1,400-point move). It then begins pulling back. Calculate the key Fibonacci levels:
- 23.6% retracement: 23,200 − (1,400 × 0.236) = 22,870
- 38.2% retracement: 23,200 − (1,400 × 0.382) = 22,665
- 50.0% retracement: 23,200 − (1,400 × 0.500) = 22,500
- 61.8% retracement: 23,200 − (1,400 × 0.618) = 22,335
If you also calculate the pivot points for this session using our Pivot Point Calculator and find that S1 is at 22,330 — the confluence of S1 and the 61.8% Fibonacci level at 22,335 creates a very high-probability support zone. Both would need to break with force before the trade thesis is invalidated.
When Fibonacci Retracement Does NOT Work
Fibonacci levels are not magic. They fail in predictable situations:
- Ranging / choppy markets: Without a clear prior trend, there is no meaningful swing to measure. Fibonacci drawn on a sideways market produces useless levels.
- Gap-driven moves: Post-earnings or macro-event gaps often skip through Fibonacci levels entirely without pausing.
- News-driven reversals: Fundamental news can override any technical level. A company reporting a profit warning can crash through every Fibonacci support in seconds.
- Very short timeframes: On 1-minute charts, Fibonacci levels are often noise — they work best on 15-minute, 1-hour, and daily charts where institutional traders are making decisions based on the same levels.
What are Fibonacci retracement levels?
Fibonacci retracement levels are horizontal lines drawn on a price chart at specific percentages of a prior trending move — 23.6%, 38.2%, 50%, 61.8%, and 78.6%. They indicate zones where a pullback within a trend may pause or reverse before the original trend continues. These levels are derived from the Fibonacci mathematical sequence and its key ratios. The 61.8% level (the "Golden Ratio") is the most significant, while 38.2% and 50% are also widely watched by traders across all markets and timeframes.
How do you use Fibonacci retracement in trading?
To use Fibonacci retracement: identify a clear directional move with a significant swing high and swing low, draw the Fibonacci tool from the swing low to swing high (for uptrends) or swing high to swing low (for downtrends), and watch the 38.2%, 50%, and 61.8% levels for potential reversals. Never enter a trade at a Fibonacci level alone — wait for a confirming candlestick pattern (hammer, engulfing) or confluence with another technical level like a pivot point or moving average. Place your stop-loss just below the next Fibonacci level below your entry.
What is the most important Fibonacci retracement level?
The 61.8% Fibonacci retracement level — known as the "Golden Ratio" — is the most important and most watched level in technical analysis. It is derived from dividing any Fibonacci number by the next in the sequence (e.g., 34 ÷ 55 = 0.618). The 61.8% level frequently acts as the last major support in an uptrend before a move is considered a full reversal rather than a pullback. Institutional traders and algorithms often place orders at this level, creating the self-reinforcing dynamic that makes it so reliable.
Is 50% a Fibonacci level?
The 50% level is not a mathematically derived Fibonacci ratio, but it is widely included in Fibonacci retracement tools because markets frequently retrace exactly half of a prior move before continuing. This observation was noted by Dow Theory and Robert Rhea decades before Fibonacci analysis became mainstream. The 50% level behaves as a Fibonacci level in practice because so many traders watch and trade around it, creating the same self-reinforcing dynamic as the true ratios like 38.2% and 61.8%.
Does Fibonacci retracement work on Indian stocks and Nifty?
Yes — Fibonacci retracement levels are used extensively by Indian technical analysts and traders on Nifty 50, Bank Nifty, individual stocks, and commodities. The 61.8% and 38.2% levels are regularly cited in NSE/BSE market analysis commentary. The key is to apply Fibonacci to significant swing points on appropriate timeframes — the 15-minute, hourly, and daily charts — rather than trying to use it on 1-minute scalping charts where the levels lose precision. Fibonacci combined with pivot points and volume analysis is particularly popular among Indian intraday traders.


