Key Takeaways
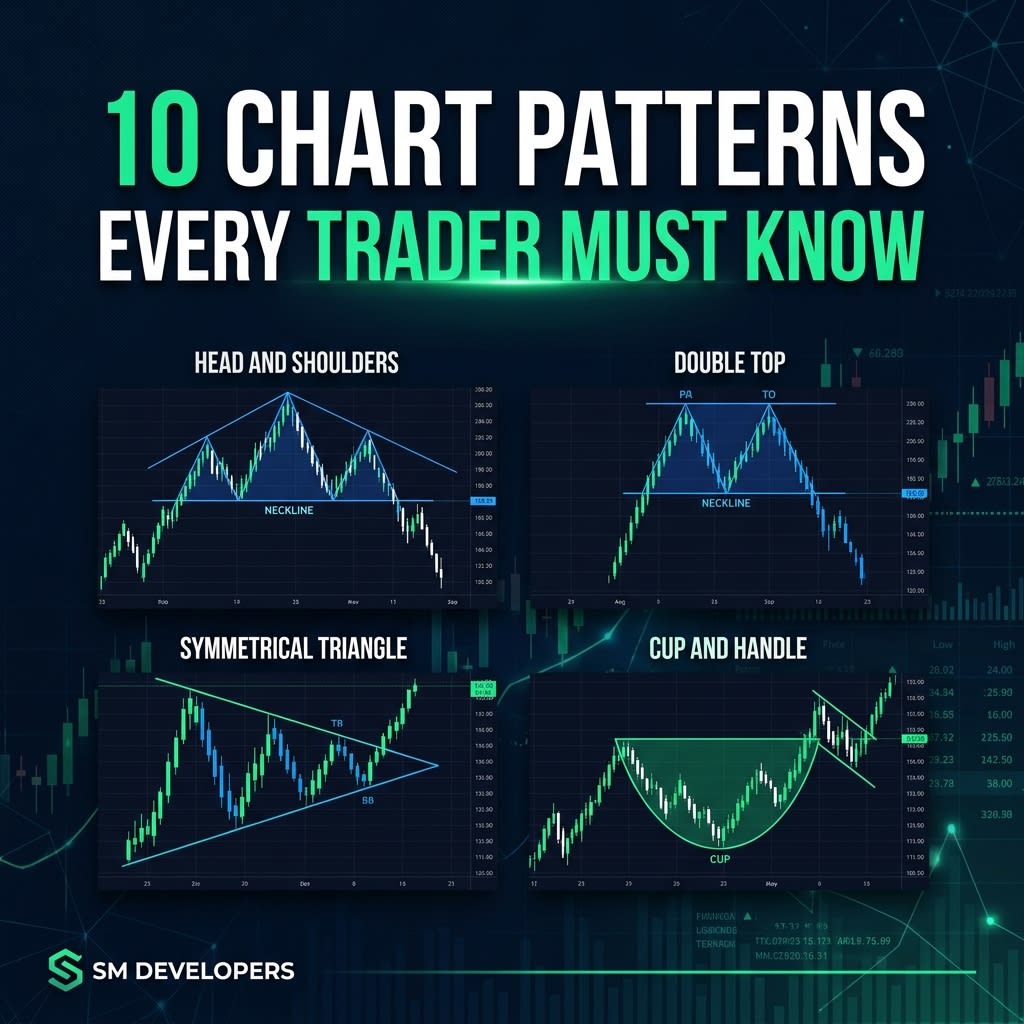
- The 10 essential chart patterns: Head & Shoulders, Inverse H&S, Double Top, Double Bottom, Cup & Handle, Bull Flag, Bear Flag, Ascending Triangle, Descending Triangle, Symmetrical Triangle
- Every pattern has a measurable price target using the "measured move" technique
- Volume must confirm breakouts — low-volume breakouts fail significantly more often
- Head and Shoulders and Inverse H&S have the highest statistical success rate at 83%
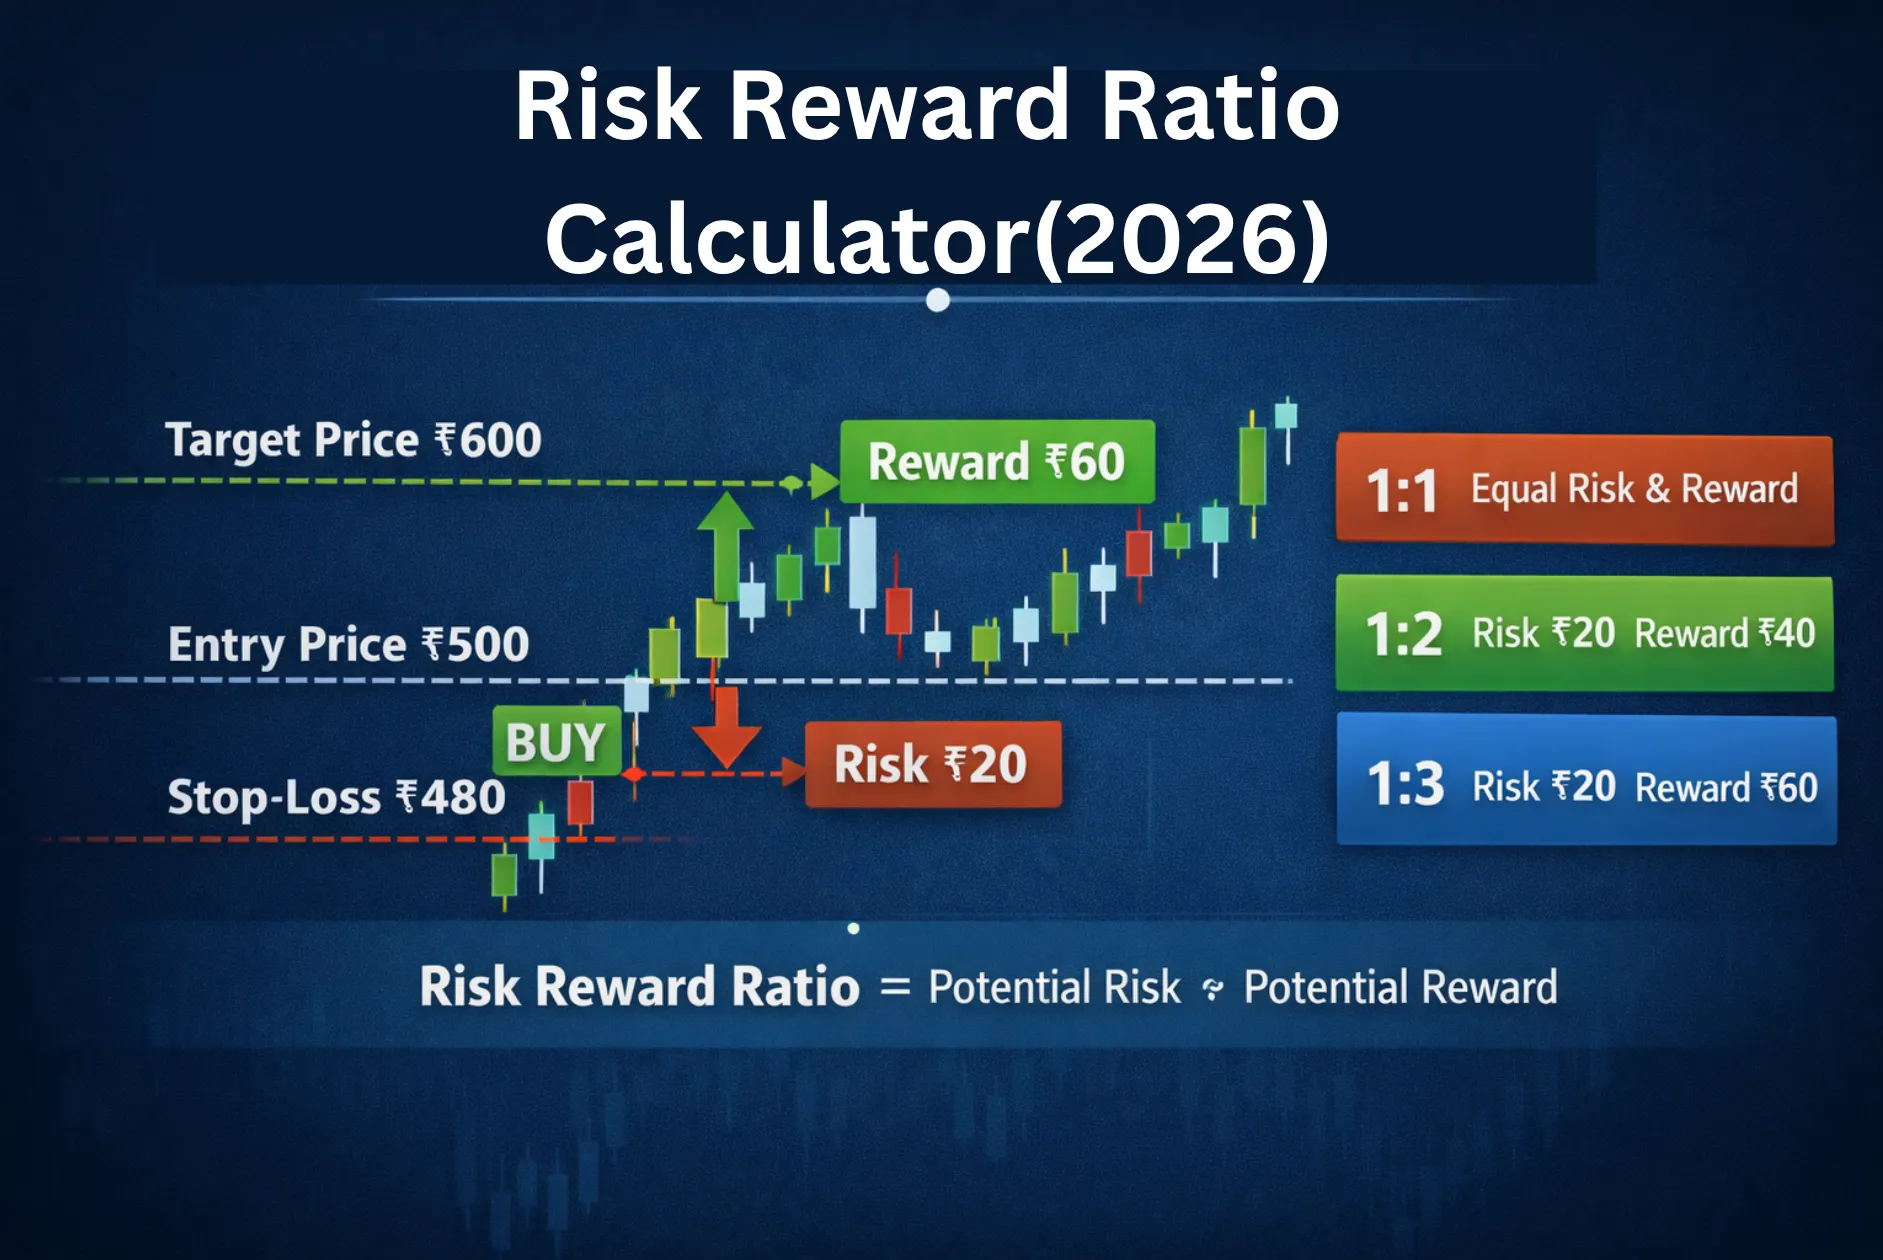
- Always verify risk-reward (minimum 2:1) before entering any pattern trade
What Are Chart Patterns in Trading?
Chart patterns are recognizable formations that appear on price charts, created by the movement of an asset's price over time. They represent the collective psychology of all buyers and sellers in the market — their fear, greed, hesitation, and conviction — compressed into a visual structure that repeats across all markets and timeframes.
Professional traders use chart patterns to identify high-probability trading opportunities before they develop. Each pattern has a defined entry point, a logical stop-loss placement, and a measurable price target — making them a complete trade framework, not just a visual indicator.
This guide covers the 10 most important chart patterns, how to identify each one, what it signals, and exactly how to trade it.
1. Head and Shoulders Pattern
The Head and Shoulders is one of the most reliable bearish reversal patterns in technical analysis. It forms after a sustained uptrend and signals a high-probability trend reversal from bullish to bearish.
How to identify it:
- Left Shoulder: price rises to a peak, then pulls back
- Head: price rises again to a higher peak, then pulls back to the same support level (neckline)
- Right Shoulder: price rises one more time but fails to reach the head's peak, then falls back to the neckline
- Neckline: the horizontal support line connecting the two pullback lows
Signal: Bearish reversal — the pattern completes and activates when price breaks below the neckline with increased volume.
How to trade it:
- Entry: short position on the neckline break (close below neckline on strong volume)
- Stop-Loss: above the right shoulder high
- Price Target: measure the distance from the head's peak to the neckline, then project that distance downward from the neckline break point
| Component | Significance | Volume |
|---|---|---|
| Left shoulder formation | First sign of weakening trend | High on rally |
| Head formation | Final push of the old trend | Lower than left shoulder |
| Right shoulder formation | Buyers losing control | Lowest of the three |
| Neckline break | Pattern confirmation | Should spike significantly |
2. Inverse Head and Shoulders Pattern
The Inverse Head and Shoulders is the bullish mirror image of the Head and Shoulders. It forms at the bottom of a downtrend and signals a high-probability reversal from bearish to bullish.
How to identify it: Three troughs where the middle trough (head) is the lowest, and the two outer troughs (shoulders) are at approximately the same level. The neckline connects the two peaks between the troughs.
Signal: Bullish reversal — confirmed when price breaks above the neckline on strong volume.
How to trade it:
- Entry: long position on the neckline breakout
- Stop-Loss: below the right shoulder low
- Price Target: head-to-neckline distance projected upward from the breakout point
Pair this pattern analysis with the Risk-Reward Calculator to confirm the trade meets your minimum 2:1 ratio before entry.
3. Double Top Pattern
The Double Top is a bearish reversal pattern that forms when price tests the same resistance level twice, fails to break through on both attempts, and then reverses downward. It is one of the most frequently occurring and reliable reversal patterns across all timeframes.
How to identify it:
- Two price peaks at approximately the same level, separated by a moderate pullback (the valley)
- The second peak fails to significantly exceed the first — indicating buying momentum is exhausted
- The support level (neckline) connects the valley between the two peaks
Signal: Bearish reversal — confirmed on a close below the neckline (valley low) with increased volume.
How to trade it:
- Entry: short on neckline break confirmation
- Stop-Loss: above both peaks (above the highest point of the pattern)
- Price Target: distance from peaks to neckline, projected downward from the neckline break
4. Double Bottom Pattern
The Double Bottom is the bullish mirror of the Double Top. It forms when price tests the same support level twice, holds on both attempts, and then reverses upward. It is an extremely reliable long setup, especially on higher timeframes.
How to identify it: Two price troughs at approximately the same level, separated by a moderate rally peak (the neckline). The second trough should hold above or at the first — indicating sellers are exhausted.
Signal: Bullish reversal — confirmed when price breaks and closes above the neckline (rally peak between the two bottoms) with strong volume.
How to trade it:
- Entry: long on neckline breakout close
- Stop-Loss: below both bottoms
- Price Target: neckline-to-bottom distance projected upward from the neckline breakout
5. Cup and Handle Pattern
The Cup and Handle is a bullish continuation pattern first described by investor William O'Neil. It forms during an uptrend, signals a consolidation phase, and then resolves with a continuation of the original trend. It is one of the highest-probability bullish setups in technical analysis.
How to identify it:
- Cup: a rounded, U-shaped price decline and recovery — not a sharp V-shape. The right side of the cup should reach back to approximately the same price as the left side (the prior high)
- Handle: a brief downward drift or consolidation after the cup completes — typically declining no more than 15% from the cup's right edge
Signal: Bullish continuation — the pattern activates on a breakout above the handle's upper resistance with above-average volume.
How to trade it:
- Entry: buy the breakout above the handle's resistance level
- Stop-Loss: below the handle's lowest point
- Price Target: the depth of the cup added to the breakout point
6. Bull Flag Pattern
The Bull Flag is a short-term bullish continuation pattern that forms after a sharp, strong price move (the flagpole) followed by a tight, orderly consolidation that drifts slightly downward (the flag). It is one of the most tradeable intraday and swing trading patterns.
How to identify it:
- Flagpole: a sharp, near-vertical price increase on strong volume
- Flag: a tight rectangular consolidation that drifts slightly downward — parallel upper and lower trendlines. Volume should decrease during the flag formation
Signal: Bullish continuation — the flag breaks upward continuing the original direction of the flagpole move.
How to trade it:
- Entry: long on breakout above the upper flag trendline
- Stop-Loss: below the lower flag trendline
- Price Target: flagpole length added to the flag's breakout point
7. Bear Flag Pattern
The Bear Flag is the bearish mirror of the Bull Flag. It forms after a sharp downward move (flagpole) followed by a tight upward consolidation (flag) before continuing the downtrend.
How to identify it: A sharp downward flagpole, followed by a tight consolidation that drifts slightly upward with parallel trendlines and decreasing volume.
Signal: Bearish continuation — confirmed on a breakdown below the lower flag trendline.
How to trade it:
- Entry: short on breakdown below the flag's lower trendline
- Stop-Loss: above the flag's upper trendline
- Price Target: flagpole length projected downward from the breakdown point
8. Ascending Triangle Pattern
The Ascending Triangle is a bullish continuation pattern characterized by a flat horizontal resistance line (buyers repeatedly test the same level) and a rising lower trendline (sellers getting weaker with each pullback). The pattern signals that buyers are gaining control.
How to identify it:
- Flat upper resistance: two or more touches at the same price level
- Rising lower trendline: each successive pullback holds at a higher low
- Volume typically decreases as the pattern compresses, then spikes on breakout
Signal: Bullish continuation (can also form as a reversal at bottoms) — confirmed on a close above the flat resistance with strong volume.
How to trade it:
- Entry: long on breakout above horizontal resistance
- Stop-Loss: below the most recent higher low (last touch of the rising trendline)
- Price Target: widest part of the triangle (from flat resistance to first touch of rising trendline) added to the breakout point
9. Descending Triangle Pattern
The Descending Triangle is the bearish counterpart to the Ascending Triangle. It features a flat horizontal support level (sellers repeatedly defend) and a declining upper trendline (buyers getting weaker at each attempt). The pattern signals increasing seller control.
How to identify it:
- Flat lower support: two or more touches at the same price level
- Declining upper trendline: each rally attempt reaches a lower high than the previous one
Signal: Bearish continuation (also valid as a reversal at tops) — confirmed on a close below the flat support level with strong volume.
How to trade it:
- Entry: short on breakdown below flat support
- Stop-Loss: above the most recent lower high
- Price Target: triangle height projected downward from the breakdown point
10. Symmetrical Triangle Pattern
The Symmetrical Triangle is a neutral continuation pattern that forms when price makes lower highs and higher lows simultaneously — compressing into an apex. It represents a period of indecision between buyers and sellers, with the resolution (breakout) typically continuing in the direction of the prior trend.
How to identify it:
- Declining upper trendline: progressively lower highs
- Rising lower trendline: progressively higher lows
- The two lines converge toward an apex, with volume declining as the pattern forms
Signal: Continuation in the prior trend direction — but the direction of the breakout must be confirmed before entry. Trading the breakout direction rather than anticipating it is the professional approach.
How to trade it:
- Entry: on the confirmed breakout direction (above upper trendline for long, below lower trendline for short)
- Stop-Loss: on the opposite trendline from the breakout direction
- Price Target: widest part of the triangle (at the leftmost point) projected in the breakout direction from the apex
Chart Pattern Success Rates: What the Data Shows
| Pattern | Direction | Avg. Success Rate | Avg. Price Move |
|---|---|---|---|
| Inverse Head & Shoulders | Bullish reversal | 83% | +37% |
| Cup and Handle | Bullish continuation | 68% | +34% |
| Double Bottom | Bullish reversal | 72% | +26% |
| Ascending Triangle | Bullish continuation | 72% | +36% |
| Bull Flag | Bullish continuation | 67% | +23% |
| Head & Shoulders | Bearish reversal | 83% | -22% |
| Double Top | Bearish reversal | 75% | -19% |
| Descending Triangle | Bearish continuation | 72% | -31% |
| Bear Flag | Bearish continuation | 67% | -22% |
| Symmetrical Triangle | Continuation (both) | 58% | ±19% |
Success rates based on Thomas Bulkowski's Encyclopedia of Chart Patterns — the most comprehensive statistical study of chart pattern performance across thousands of historical examples.
5 Rules for Trading Chart Patterns Profitably
- Wait for confirmation: Never enter on a pattern that hasn't completed and broken out. Anticipating a breakout means you are often wrong, and the stop-loss distance is larger. Wait for the close beyond the key level.
- Volume must confirm the breakout: A breakout on below-average volume has a significantly higher failure rate. Strong volume on the breakout bar is the signal that institutional money is participating.
- Use the measured move for price targets: Every pattern has a defined target measurement. Use it. Don't hold past the target hoping for more — the pattern has defined the probable move.
- Always calculate risk-reward before entry: If the pattern's logical stop-loss placement means your risk-reward ratio is below 2:1, skip the trade. Use the Risk-Reward Calculator to confirm every pattern trade.
- Confirm with higher timeframe context: A bullish pattern on the 1-hour chart is significantly stronger if the daily chart is also in an uptrend. Never trade a bullish pattern against the dominant trend on a higher timeframe.
How to Calculate Your Break-Even on Pattern Trades
Every chart pattern trade has a break-even price — the level the position must reach just to cover your entry cost, commissions, and spread. Use the Break-Even Calculator to calculate this number before entry. Setting your first profit target at break-even (and moving your stop there once reached) is a core professional risk management technique that eliminates the possibility of a losing trade on any position that has moved in your favor.
Key Takeaways
- Chart patterns are repeating price formations that signal high-probability entry points with defined targets and stop placements
- The 10 essential patterns: Head & Shoulders, Inverse H&S, Double Top, Double Bottom, Cup & Handle, Bull Flag, Bear Flag, Ascending Triangle, Descending Triangle, Symmetrical Triangle
- Every pattern has a measured move price target — always calculate it before entry
- Volume confirmation on the breakout is mandatory — pattern breakouts on low volume fail significantly more often
- Always calculate risk-reward before entering any pattern trade — minimum 2:1 is the professional standard
What are the most reliable chart patterns?
Based on Thomas Bulkowski's statistical research across thousands of patterns, the most reliable are: Inverse Head and Shoulders (83% success rate, bullish reversal), Head and Shoulders (83% success rate, bearish reversal), Double Bottom (72% success rate), and Ascending Triangle (72% success rate). Success rates are significantly higher when volume confirms the breakout and the pattern aligns with the higher timeframe trend direction.
How do you trade a Head and Shoulders pattern?
Identify the three peaks (left shoulder, head, right shoulder) and draw the neckline connecting the two pullback lows. Enter a short position on a confirmed close below the neckline on strong volume. Place your stop-loss above the right shoulder's high. Calculate the price target by measuring the distance from the head's peak to the neckline, then project that same distance downward from the neckline break point.
What is the difference between a bull flag and a cup and handle?
A Bull Flag forms after a sharp, near-vertical price spike (flagpole) and consists of a brief, tight rectangular consolidation drifting slightly downward. It resolves quickly — typically within 1–4 weeks. A Cup and Handle forms a deeper, rounder U-shaped correction (the cup) followed by a shorter drift (the handle). The Cup and Handle typically takes weeks to months to fully form and signals a larger, more sustained move. Both are bullish continuation patterns, but Cup and Handle has a larger average price move upon breakout.
How do you set price targets for chart patterns?
Every major chart pattern uses the "measured move" technique. Measure the height of the pattern (from the pattern's extreme point to the breakout level), then project that same distance in the breakout direction from the breakout point. For Head and Shoulders: head peak to neckline distance, projected down from neckline. For triangles: widest part of the triangle, projected from the breakout. For flags: flagpole length, projected from the flag breakout.
Do chart patterns work in all markets?
Yes — chart patterns work in stocks, forex, cryptocurrencies, commodities, futures, and indices. They are effective across all liquid markets because they reflect universal human psychology (fear and greed) expressed through price movement. They also work across all timeframes, from 5-minute charts for day trading to weekly charts for position trading. Higher timeframe patterns are generally more reliable and produce larger measured moves.
What volume should I look for on a chart pattern breakout?
Volume should be above the 20-day average on the breakout bar — ideally 150–300% of average volume. This surge in volume indicates institutional participation in the move. Breakouts on below-average volume (sometimes called "low-volume breakouts") have a significantly higher failure rate and should be avoided or traded with reduced position size until volume confirms the move.