Key Takeaways
- Candlestick charts are the universal language of trading — used by traders from Tokyo to Mumbai to interpret price action. Each candlestick tells the story of a battle between buyers and sellers in a
How to Read a Candlestick
Every candlestick has 4 components:
- Open: Price at which the period started
- Close: Price at which the period ended
- High: Highest price reached during the period
- Low: Lowest price reached during the period
The body (rectangle between open and close) represents the net movement. The wicks/shadows (thin lines above and below the body) show the high and low extremes.
- Green/White candle: Close higher than Open — buyers won this period
- Red/Black candle: Close lower than Open — sellers won this period
- Long wick: Price was pushed significantly in one direction but reversed — rejection of extreme levels
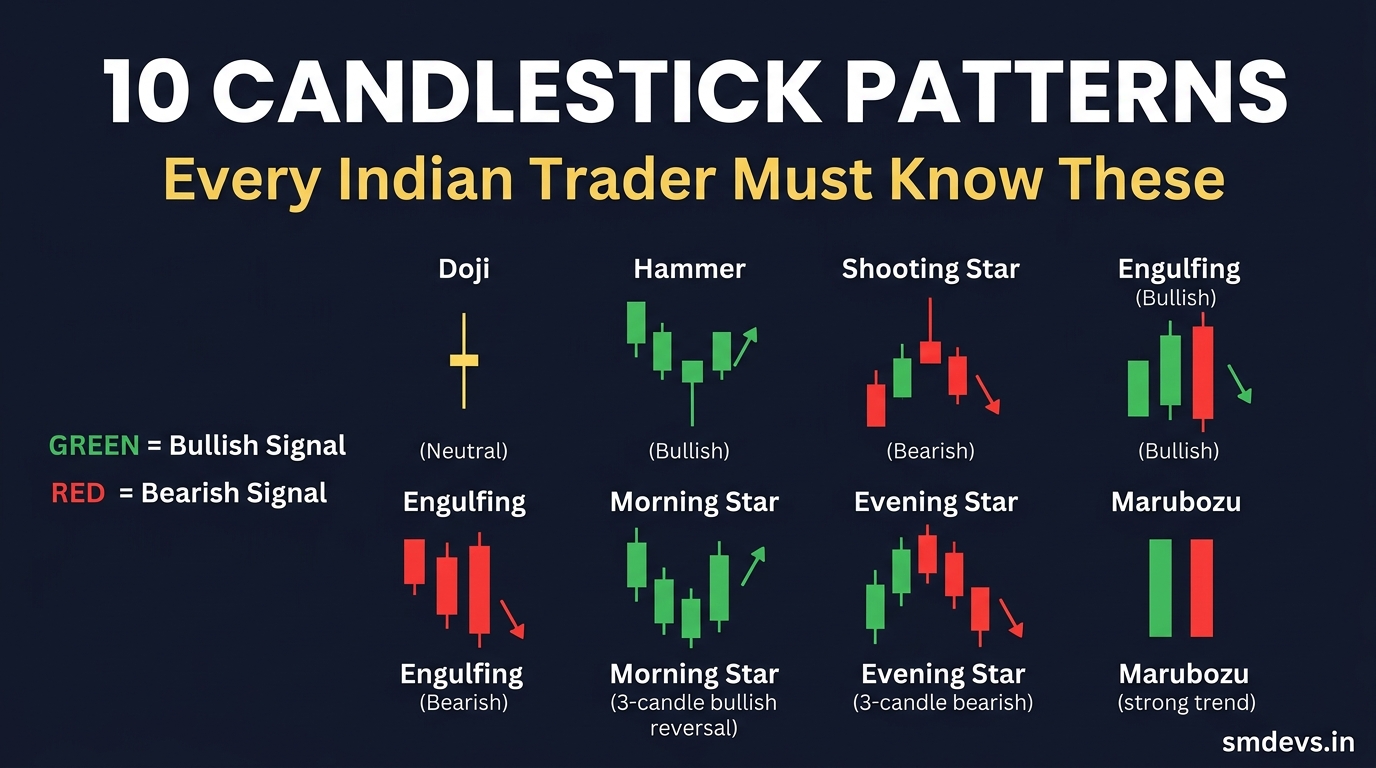
1. Doji — Indecision and Potential Reversal
A Doji has an open and close at nearly the same price — resulting in a very small body (sometimes just a line) with wicks on both sides. It signals market indecision — neither buyers nor sellers won decisively.
Signal: A Doji after a strong trend (uptrend or downtrend) often signals potential reversal. A Doji in the middle of sideways movement is less significant.
Entry rule: Do NOT trade a Doji alone. Wait for the next candle to confirm direction — if a bearish candle follows a Doji at the top of an uptrend, that's the short signal. If a bullish candle follows a Doji at the bottom of a downtrend, that's the long signal.
Types: Standard Doji (balanced wicks), Gravestone Doji (long upper wick, no lower wick — bearish at tops), Dragonfly Doji (long lower wick, no upper wick — bullish at bottoms)
2. Hammer — Bullish Reversal at Support
A Hammer has a small body at the top and a long lower wick (at least 2x the body length), with little or no upper wick. It forms after a downtrend and signals potential bullish reversal.
Psychology: Price fell sharply during the period, but buyers stepped in aggressively and pushed it back up near the opening level. Sellers tried and failed — momentum may be shifting.
Entry rule: Confirmed Hammer entry — wait for the next candle to close bullish (green) above the Hammer's close. Enter long above the confirmation candle's high. Stop loss: below the Hammer's low.
Best context: Hammer at a major support level (50-day MA, previous resistance turned support, Pivot Point S1/S2). A Hammer in open air without support below is less reliable.
3. Shooting Star — Bearish Reversal at Resistance
The mirror image of the Hammer — small body at the bottom, long upper wick (2x+ body), little/no lower wick. Forms after an uptrend and signals potential bearish reversal.
Psychology: Price rallied strongly during the period, but sellers overwhelmed buyers and pushed it back down near the open. Buyers tried and failed — momentum may be weakening.
Entry rule: Wait for the next candle to close bearish (red). Enter short below the confirmation candle's low. Stop loss: above the Shooting Star's high.
Best context: Shooting Star at resistance (200-day MA, previous support turned resistance, Pivot Point R1/R2). Often appears at Nifty 50 key round number levels (24,000; 25,000).
4. Bullish Engulfing — Strong Reversal Signal
A two-candle pattern: a smaller red candle followed by a larger green candle whose body completely engulfs the previous red candle's body. Forms after a downtrend.
Psychology: The second day, buyers completely overwhelmed the previous day's selling. The larger the engulfing candle relative to the previous candle, the stronger the signal.
Entry rule: Enter long at the close of the engulfing candle, or on the open of the next candle. Stop loss: below the low of the engulfing candle (or the prior red candle's low — whichever is lower).
Best context: At clear support zones, after RSI reaches oversold territory. Among the most reliable reversal patterns in Indian index trading.
5. Bearish Engulfing — Reversal at Tops
A two-candle pattern: a smaller green candle followed by a larger red candle that completely engulfs it. Forms after an uptrend.
Entry rule: Enter short at the close of the engulfing red candle. Stop loss: above the high of the engulfing candle. Target: prior support level.
Real example: Nifty 50 has repeatedly formed bearish engulfing patterns at key resistance levels (21,000; 23,000; 25,000 psychological levels) that preceded short-term corrections.
6. Morning Star — Powerful 3-Candle Bullish Reversal
A three-candle pattern at the bottom of a downtrend:
- Day 1: Large red candle (continuing the downtrend)
- Day 2: Small body (Doji or small candle — indecision) that gaps down from Day 1
- Day 3: Large green candle that closes at least 50% into Day 1's body
Entry rule: Enter long on the close of Day 3. Stop loss: below the low of Day 2 (the Doji candle). This is a high-conviction pattern — when it appears at major support with confirmation from RSI oversold, it's among the most reliable bullish reversals.
7. Evening Star — 3-Candle Bearish Reversal
The bearish counterpart of Morning Star — forms at tops:
- Day 1: Large green candle (continuing uptrend)
- Day 2: Small body (indecision) that gaps up from Day 1
- Day 3: Large red candle that closes at least 50% into Day 1's body
Entry rule: Enter short on the close of Day 3. Stop loss: above the high of Day 2.
8. Marubozu — Trend Continuation
A Marubozu is a candle with no wicks — the open equals the low (for bullish Marubozu) and the close equals the high. Or: open equals the high and close equals the low (for bearish Marubozu).
Signal: Unlike reversal patterns, Marubozu is a continuation signal. A bullish Marubozu shows buyers were in complete control for the entire period — no moment of seller resistance. Expect the trend to continue.
Entry rule: Don't chase — enter on the first pullback after a bullish Marubozu. The pullback often finds support at the Marubozu's open price.
9. Inverted Hammer — Bullish After Downtrend
Similar shape to Shooting Star (small body at bottom, long upper wick) but forms after a downtrend, not an uptrend. The long upper wick shows buyers attempted a rally — though sellers pushed back, buyers are starting to emerge.
Entry rule: Only enter on confirmation from the next candle. If the next candle is bullish and closes above the Inverted Hammer's high, enter long. Stop loss: below the Inverted Hammer's low.
10. Hanging Man — Bearish After Uptrend
Identical shape to the Hammer (small body, long lower wick) but forms after an uptrend. The lower wick shows sellers are starting to step in — a warning sign despite the price being near highs.
Entry rule: Treat as a warning, not an immediate short. Wait for confirmation — if the next candle is a bearish one closing below the Hanging Man's open, enter short. Stop loss: above the Hanging Man's high.
How to Use Candlestick Patterns Correctly
- Always wait for confirmation: One-candle patterns (Doji, Hammer) need the next candle to confirm. Don't enter on the candle itself.
- Use higher timeframes for reliability: A Hammer on the daily chart is more reliable than a Hammer on the 5-minute chart. Intraday: 15m minimum; swing: daily.
- Combine with support/resistance: Patterns at key levels are 2–3x more reliable than patterns in open space. Use our Pivot Point Calculator to identify key levels.
- Combine with RSI: Bullish patterns near RSI 30 (oversold) + key support = highest-probability setup. Bearish patterns near RSI 70 (overbought) + resistance = strong sell setup. See: RSI Indicator Trading Guide.
- Always use stop losses: Every pattern fails sometimes. Define your stop before entering — for most candlestick patterns, the stop is above/below the pattern's extreme wick.
FAQs: Candlestick Patterns
Which candlestick pattern is most reliable?
The Bullish/Bearish Engulfing and Morning/Evening Star patterns are consistently cited as among the most reliable in backtests. They work best at significant support/resistance levels combined with momentum indicators like RSI or MACD. No pattern is reliable in isolation — always use confluence factors.
Do candlestick patterns work on Nifty 50?
Yes — candlestick patterns work on Nifty 50 daily and weekly charts with good reliability, particularly at key technical levels. Nifty's high liquidity makes price action cleaner than many individual stocks, reducing noise. Patterns on the 15-minute Nifty chart are also widely used for intraday trading, though they produce more false signals than daily patterns.
What is the difference between a Hammer and an Inverted Hammer?
A Hammer has the small body at the top and the long wick pointing down — it forms after a downtrend and is bullish. An Inverted Hammer also forms after a downtrend but has the small body at the bottom and the long wick pointing up — it also signals a potential bullish reversal, but is slightly less reliable and requires stronger confirmation from the next candle.


