Key Takeaways
- Candlestick patterns are most reliable at key support and resistance levels
- Always wait for the next candle to confirm before entering
- Volume confirmation significantly improves pattern reliability
- Bullish/Bearish Engulfing and Morning/Evening Star are statistically most reliable
- Context is everything — the same pattern has different meanings in different trend phases
Candlestick charts are the universal language of price action. Every bar on a candlestick chart tells a story about the battle between buyers and sellers during that time period — who won, who lost, and by how much. Traders who can read these patterns fluently have a significant edge over those who rely solely on lagging indicators.
This guide covers the 12 most important candlestick patterns every serious trader must know — 6 bullish reversals and 6 bearish reversals — along with the correct way to trade each one.
How to Read a Single Candlestick
Before learning patterns, understand what a single candlestick tells you:
- Body: The thick colored section between the open and close. A green (or white) body means the close was higher than the open — buyers won. A red (or black) body means the close was lower than the open — sellers won.
- Upper Wick (Shadow): The thin line above the body. Represents the highest price reached during the period. A long upper wick means buyers pushed price high but sellers pushed it back down.
- Lower Wick (Shadow): The thin line below the body. Represents the lowest price reached during the period. A long lower wick means sellers pushed price low but buyers pushed it back up.
The relative size of the body versus the wicks tells you who had control and how convincingly they won the battle.
Key Takeaways
- Candlestick patterns are most reliable at key support and resistance levels. A hammer in open air is far less reliable than a hammer sitting right on major support.
- Volume confirms the pattern. A bullish engulfing pattern on low volume is suspect. On high volume, it is a powerful signal.
- Context is everything. A Hammer is bullish only when it appears at the bottom of a downtrend. The same pattern at the top of an uptrend has a different meaning.
- Confirm before entering. Never enter on a candlestick pattern alone. Wait for the next candle to confirm the direction before committing capital.
- These are probability signals, not certainties. Even the most reliable patterns fail 30–40% of the time. Risk management is non-negotiable.
The 6 Bullish Reversal Patterns
These patterns appear at market bottoms and signal a potential shift from bearish to bullish momentum.
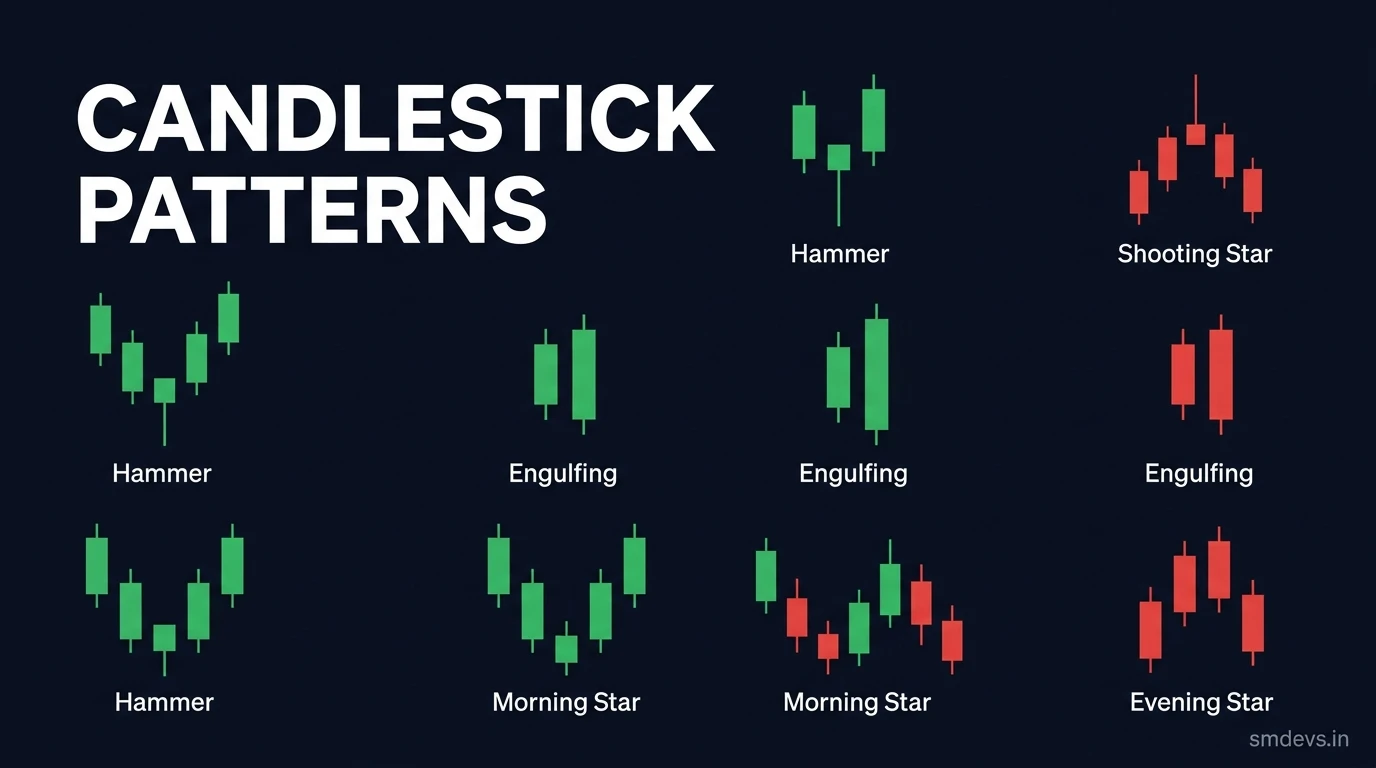
1. Hammer
What it looks like: A small body (green or red) near the top of the candle's range, with a very long lower wick — typically at least twice the length of the body. Little to no upper wick.
What it means: Sellers pushed the price significantly lower during the session, but buyers aggressively stepped in and drove the price back up near the open. The long lower wick is evidence of strong buying pressure at those lows.
How to trade it: Look for the Hammer to appear after a sustained decline and at a key support level. The next candle must be a bullish confirmation candle (closing above the Hammer's high). Place your stop loss below the Hammer's low.
Key rule: A green Hammer (close above open) is more bullish than a red Hammer, but both are valid signals when in the right context.
2. Bullish Engulfing
What it looks like: A two-candle pattern. The first candle is bearish (red). The second candle is a large bullish (green) candle whose body completely engulfs the body of the first candle — opening below the first candle's close and closing above the first candle's open.
What it means: Sellers had control on day one, but buyers completely overwhelmed them on day two — a decisive shift in power.
How to trade it: This is one of the most reliable reversal patterns. Enter on the close of the engulfing candle or the open of the next candle. Stop goes below the low of the two-candle pattern. The larger the engulfing candle relative to the first, the more significant the signal.
3. Morning Star
What it looks like: A three-candle pattern: (1) a large bearish candle, (2) a small-bodied candle (Doji or Spinning Top) that gaps below the first candle, (3) a large bullish candle that closes into the body of the first candle.
What it means: The first candle shows strong selling. The middle candle shows indecision — neither buyers nor sellers can take control. The third candle shows buyers winning decisively.
How to trade it: Enter after the third candle closes. The larger the third candle closes into the first candle's body, the more powerful the reversal. Stop goes below the low of the second candle.
4. Piercing Line
What it looks like: A two-candle pattern. The first is a bearish candle. The second opens below the prior candle's close (a gap down) but then rallies to close above the midpoint of the first candle's body.
What it means: Despite gapping lower — which initially favours sellers — buyers drove price back up to reclaim more than half of the prior bearish candle. Momentum is shifting.
How to trade it: The key requirement is that the second candle must close above the 50% level of the first candle. If it closes below 50%, it is a weaker pattern called an "On Neck" and should be avoided.
5. Dragonfly Doji
What it looks like: A cross-shaped candle where the open, close, and high are all at (or very near) the same level, with a very long lower wick. The body is at the very top of the range.
What it means: Sellers drove price significantly lower during the session, but buyers completely reclaimed all those losses by the close — showing extreme buying strength. The virtually non-existent upper wick shows sellers had no ability to push price higher either.
How to trade it: Most powerful at a key support level or after an extended downtrend. Confirmation on the next candle is essential before entering.
6. Morning Doji Star
What it looks like: Similar to the Morning Star, but the middle candle is specifically a Doji (open and close are virtually identical), representing maximum indecision at the bottom of the downtrend.
What it means: The Doji at the bottom of a move signals that the selling momentum has completely stalled. The subsequent bullish candle confirms that buyers have taken over.
How to trade it: This is considered more powerful than the standard Morning Star because the Doji specifically confirms the complete exhaustion of selling pressure.
The 6 Bearish Reversal Patterns
These patterns appear at market tops and signal a potential shift from bullish to bearish momentum.
1. Shooting Star
What it looks like: The bearish mirror of the Hammer. A small body near the bottom of the candle's range with a very long upper wick — at least twice the body length. Little to no lower wick.
What it means: Buyers pushed price significantly higher during the session, but sellers drove it all the way back down near the open. The long upper wick shows buyers exhausted at the highs.
How to trade it: Most reliable at a key resistance level after a sustained rally. Wait for the next candle to confirm bearish continuation. Place stop above the Shooting Star's high.
2. Bearish Engulfing
What it looks like: The bearish mirror of the Bullish Engulfing. A small bullish candle followed by a large bearish candle whose body completely engulfs the prior candle.
What it means: Buyers were in control on day one, but sellers overwhelmed them completely on day two. A decisive power shift to the bears.
How to trade it: One of the most reliable bearish signals. Enter short after the engulfing candle closes or on the next candle's open. Stop above the engulfing candle's high. Volume should be rising on the bearish engulfing candle.
3. Evening Star
What it looks like: The bearish mirror of the Morning Star. Three candles: (1) large bullish, (2) small-bodied/Doji, (3) large bearish that closes significantly into the first candle's body.
What it means: Buyers were dominant on day one. Day two showed indecision at the highs. Day three confirmed sellers took control.
How to trade it: Enter short after the third candle closes. The deeper the third candle closes into the first candle's body, the more powerful the reversal. Stop above the high of the second candle.
4. Dark Cloud Cover
What it looks like: A two-candle pattern. First candle is bullish. Second candle opens above the first candle's close (gap up, showing initial bullish optimism) but then reverses to close below the midpoint of the first candle's body.
What it means: Despite the bullish gap open, sellers overwhelmed buyers and drove price below the prior candle's midpoint — a significant reversal of bullish momentum.
How to trade it: The close must be below the 50% level of the first candle to be valid. More bearish the deeper it closes. Most reliable at resistance after a prolonged uptrend.
5. Gravestone Doji
What it looks like: The bearish mirror of the Dragonfly Doji. Open, close, and low are all at (or very near) the same level, with a very long upper wick. Body is at the very bottom of the range.
What it means: Buyers drove price aggressively higher during the session, but sellers completely reclaimed all gains and pushed price back to the open by the close. Extreme selling pressure at the highs.
How to trade it: Most powerful at a key resistance level or after a sustained rally. Always require next-candle confirmation before entering a short position.
6. Hanging Man
What it looks like: Identical shape to the Hammer — small body at the top of the range with a long lower wick. The critical difference is context: the Hanging Man appears at the top of an uptrend, not the bottom.
What it means: While sellers were temporarily able to push price much lower (the long wick) before buyers recovered, the fact that this selling happened during an uptrend is a warning sign. It shows sellers are beginning to appear at these elevated price levels.
How to trade it: More reliable as a warning signal than a direct short entry trigger. Look for a confirming bearish candle on the following day before acting. A red Hanging Man (close below open) is more bearish than a green one.
Pattern Reliability Ranking
| Pattern | Type | Reliability | Confirmation Required? |
|---|---|---|---|
| Bullish/Bearish Engulfing | 2-candle | High | Preferred |
| Morning Star / Evening Star | 3-candle | High | Built-in (3rd candle) |
| Hammer / Shooting Star | 1-candle | Medium-High | Required |
| Dragonfly / Gravestone Doji | 1-candle | Medium-High | Required |
| Piercing Line / Dark Cloud Cover | 2-candle | Medium | Preferred |
| Hanging Man | 1-candle | Medium | Required |
Frequently Asked Questions
Do candlestick patterns work on all timeframes?
Yes, but reliability increases with higher timeframes. A Hammer on a weekly chart is more significant than one on a 5-minute chart, because it represents a week of price action rather than five minutes. For swing trading, focus on daily and 4H candles. For position trading, weekly patterns are most meaningful. Day traders can use 15m/1H patterns but should always check daily trend direction first.
What is the most reliable single candlestick pattern?
The Bullish Engulfing and Bearish Engulfing patterns are statistically among the most reliable single-session patterns, according to multiple academic studies. Thomas Bulkowski's research ("Encyclopedia of Candlestick Charts") found that the Bullish Engulfing at a bottom with volume confirmation produces upward moves that reach their price targets approximately 63% of the time — significantly above random chance.
Should I trade a Hammer immediately when I see it?
No. Always wait for the next candle to confirm. Enter the trade after the confirmation candle closes bullish (above the Hammer's high). Entering on the Hammer candle itself is premature — the pattern is not technically complete until a subsequent candle confirms the direction. This rule applies to all single-candle patterns.
What is the difference between a Doji and a Spinning Top?
A Doji has an open and close that are virtually identical, producing an extremely small or non-existent body. A Spinning Top has a small but visible body — the open and close are different, but the body is small relative to the wicks. Both signal indecision and potential reversal, but a Doji is a stronger indecision signal because the buyers and sellers fought to an absolute stalemate.
Can I rely on candlestick patterns without using indicators?
Yes — many professional price action traders trade exclusively with candlestick patterns and support/resistance levels, using no indicators at all. However, for beginners, combining candlestick patterns with one momentum indicator (like RSI or MACD) significantly improves signal reliability and helps avoid false entries in ranging markets.
Your Next Step
Download the Candlestick Patterns Cheat Sheet infographic for a quick-reference visual guide you can keep open during your trading sessions. To develop a complete trading system, pair this knowledge with the MACD Indicator Guide for momentum confirmation and the 5 Golden Rules of Trading Risk Management to protect your capital on every trade.


