Candlestick Patterns Cheat Sheet — 12 Essential Patterns Every Trader Must Know
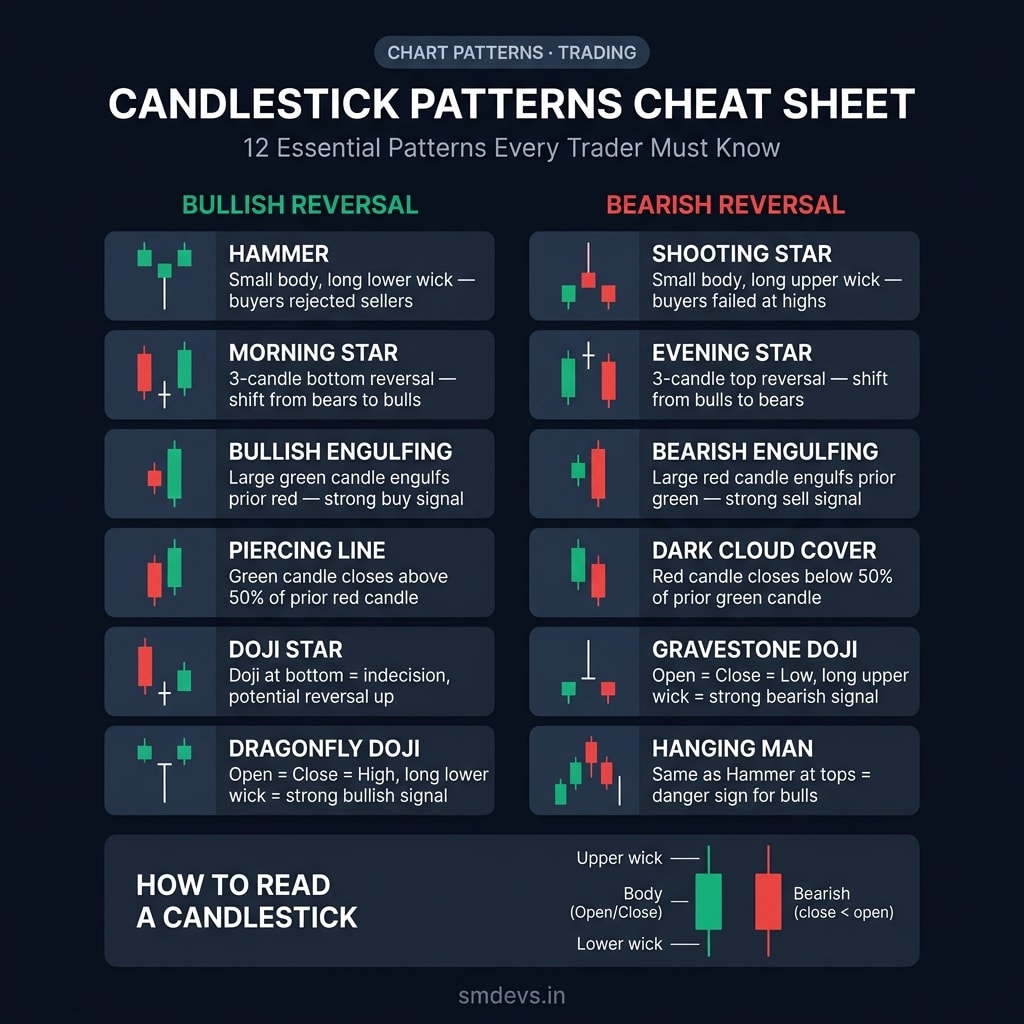
A complete visual cheat sheet of the 12 most important candlestick patterns — 6 bullish reversals and 6 bearish reversals — with diagrams and one-line trading rules.
Click to open full-screen view · Free to share with attribution
About This Infographic
Candlestick patterns are the language of price action — and mastering the 12 most important ones gives traders an immediate edge in reading market sentiment before an indicator can signal a move. This infographic presents a two-column visual cheat sheet organized by bias. Bullish Reversal Patterns: Hammer (small body, long lower wick — buyers rejected sellers at lows), Morning Star (3-candle bottom reversal from bears to bulls), Bullish Engulfing (large green candle fully engulfs the prior red candle), Piercing Line (green candle closes above 50% of prior red candle), Doji Star (doji at market lows signals indecision and potential reversal up), and Dragonfly Doji (open equals close equals high with a long lower wick — strong bullish signal). Bearish Reversal Patterns: Shooting Star (small body, long upper wick — buyers failed at highs), Evening Star (3-candle top reversal from bulls to bears), Bearish Engulfing (large red candle fully engulfs prior green candle), Dark Cloud Cover (red candle closes below 50% of prior green candle), Gravestone Doji (open equals close equals low with long upper wick — strong bearish signal), and Hanging Man (identical to Hammer but appearing in an uptrend — a warning signal for bulls). The bottom section includes a candlestick anatomy diagram showing upper wick, body (open/close), and lower wick with green for bullish and red for bearish.
Related Infographics
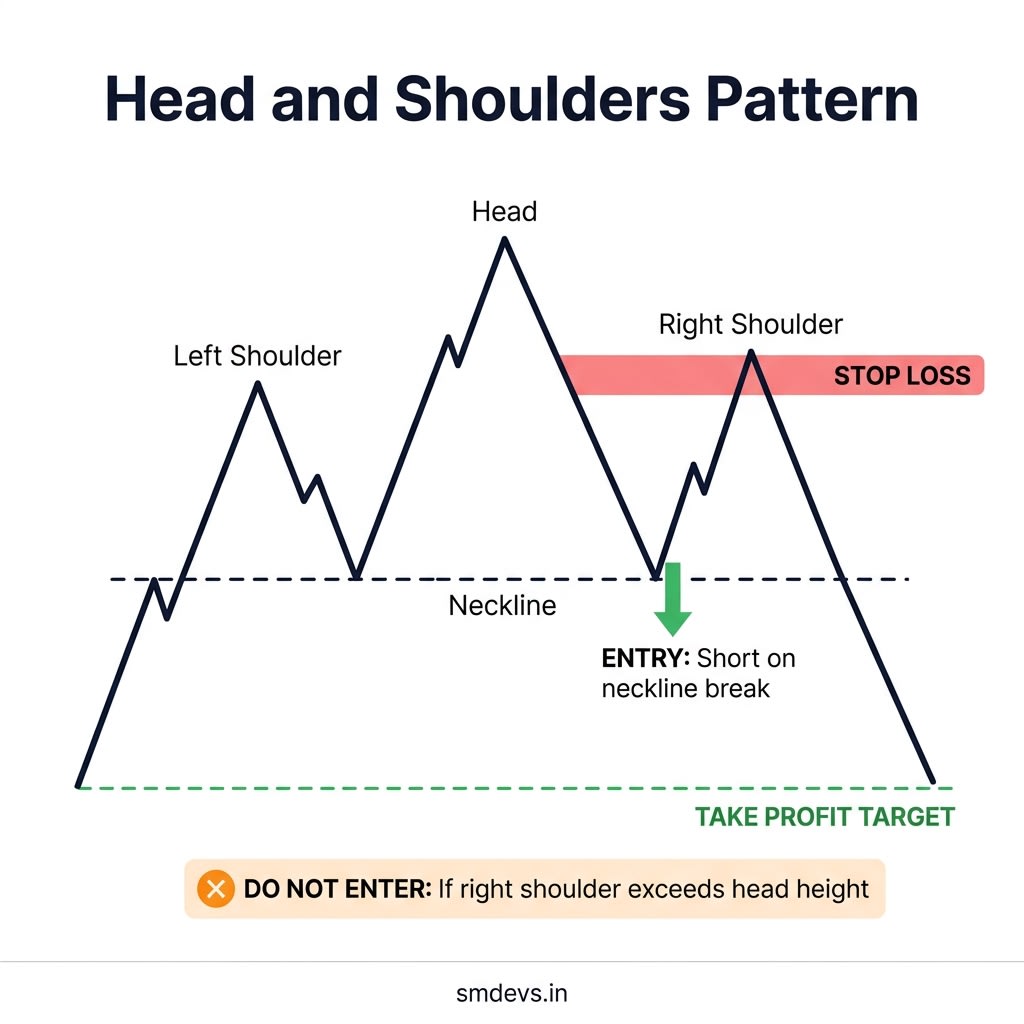
Head and Shoulders Pattern — Entry, Exit & Stop Loss Guide
How to identify the Head and Shoulders pattern, when to enter short, where to place your stop loss, and when NOT to trade it.
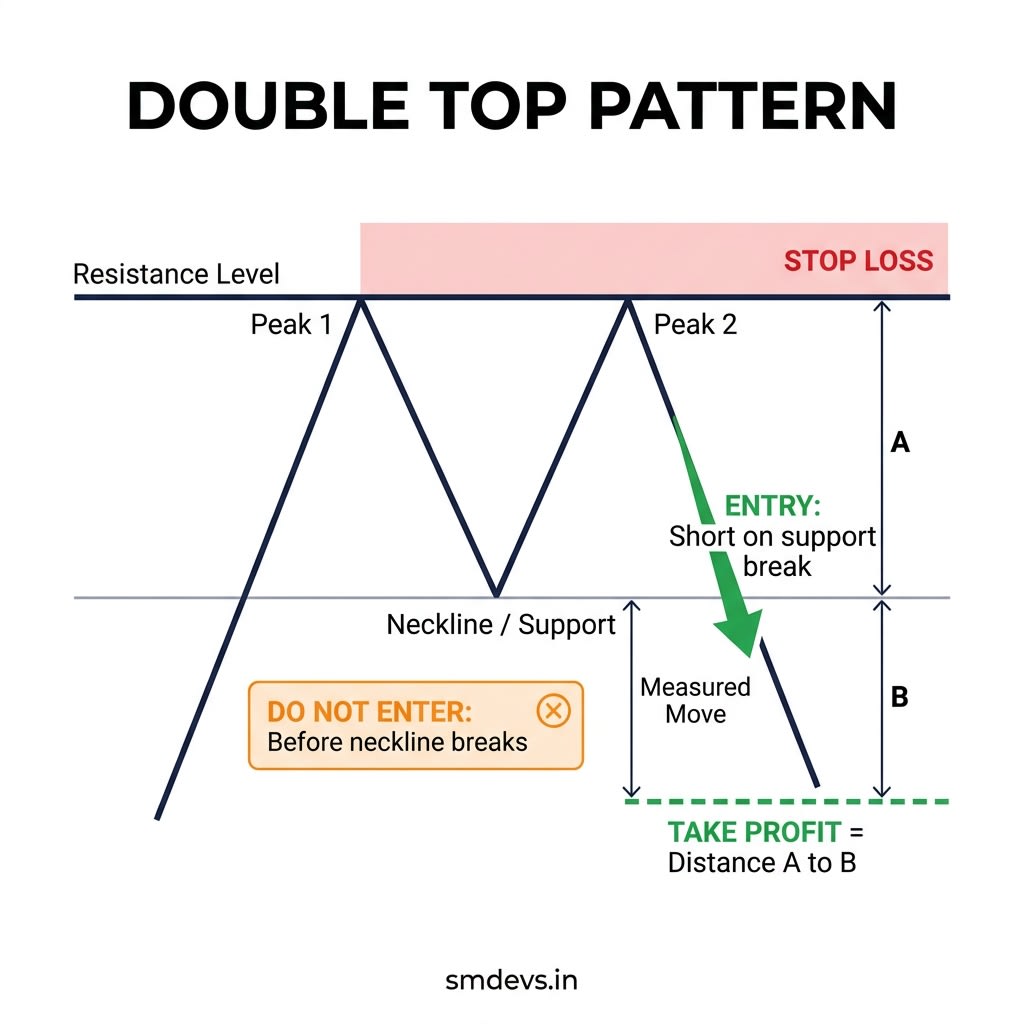
Double Top Pattern — Entry, Exit & Stop Loss Guide
How to identify a valid Double Top, when to enter short after neckline breaks, where to set your stop, and when to stay out.
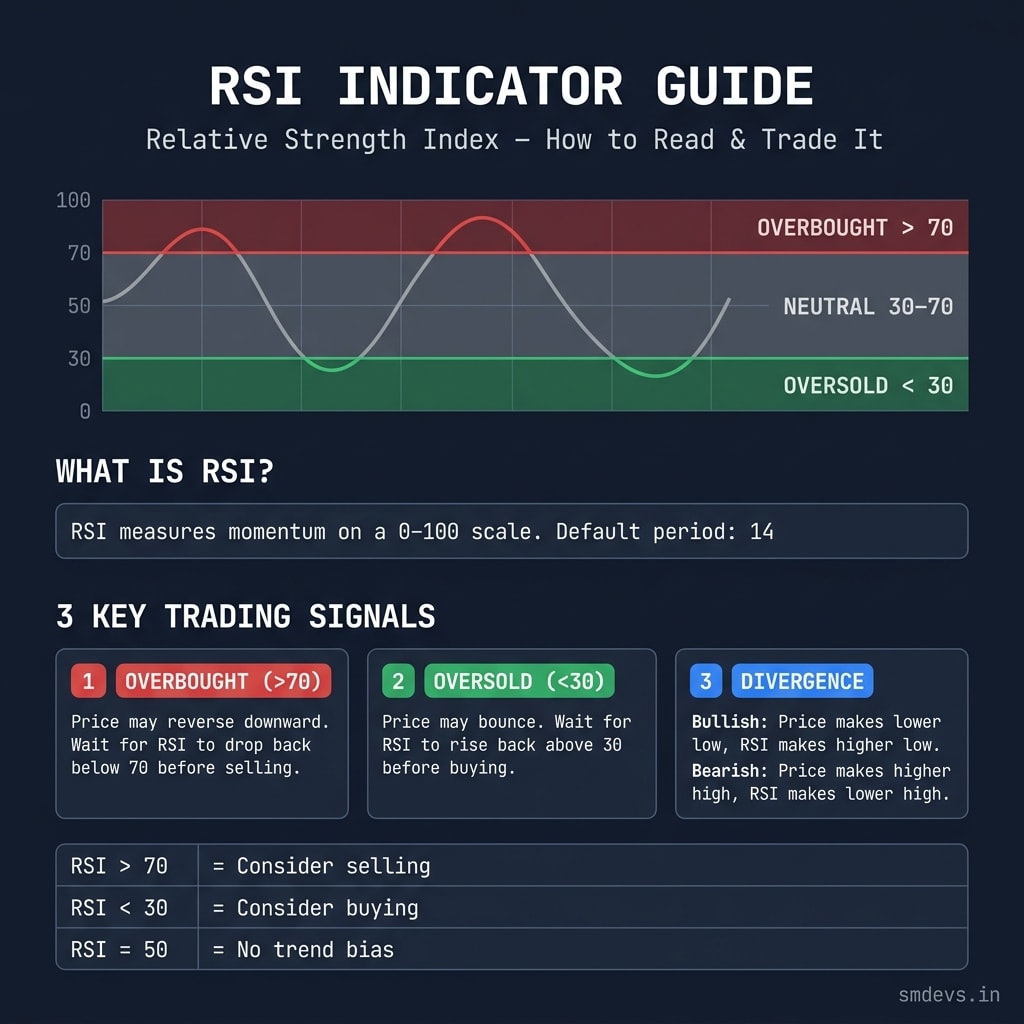
RSI Indicator Guide — Overbought, Oversold & Divergence Explained
How to read the RSI indicator, identify overbought and oversold zones, spot bullish and bearish divergence, and trade all three signals correctly.
Need Help Growing Your Website?
Use our free SEO tools to audit and optimize your site — no signup required.