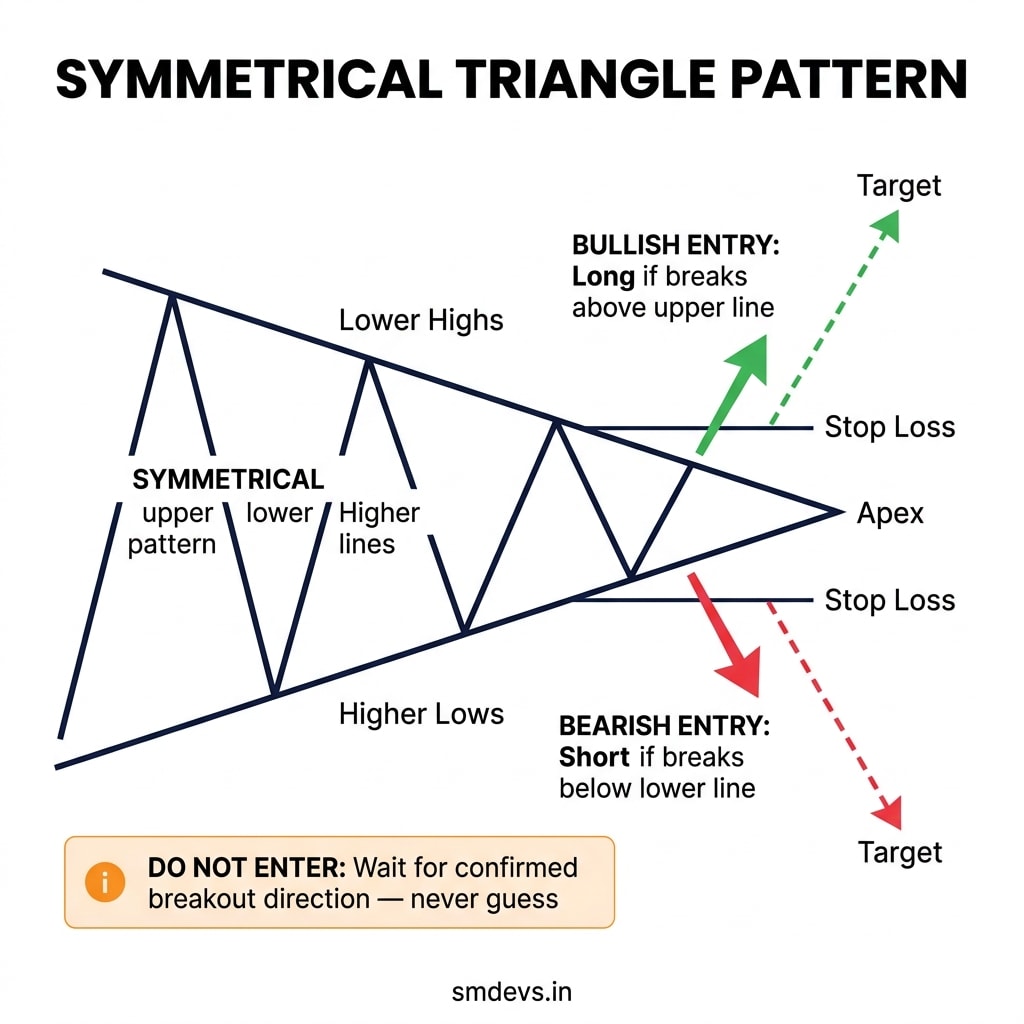
Symmetrical Triangle Pattern — Entry, Exit & Stop Loss Guide
How to identify a Symmetrical Triangle, how to trade both bullish and bearish breakouts, and why guessing the direction is the #1 mistake.
Click to open full-screen view · Free to share with attribution
About This Infographic
The Symmetrical Triangle is a neutral continuation pattern where both buyers and sellers compress into an apex — lower highs from above, higher lows from below. The direction of the breakout determines whether it's a long or short trade. This infographic shows how to draw both converging trendlines, why you must never anticipate the direction, the confirmed entry rules for both a bullish and bearish breakout, stop placement on the opposite trendline, measured move targets in both directions, and the cardinal rule — waiting for confirmation versus guessing is the difference between professional and amateur trading.
Related Infographics
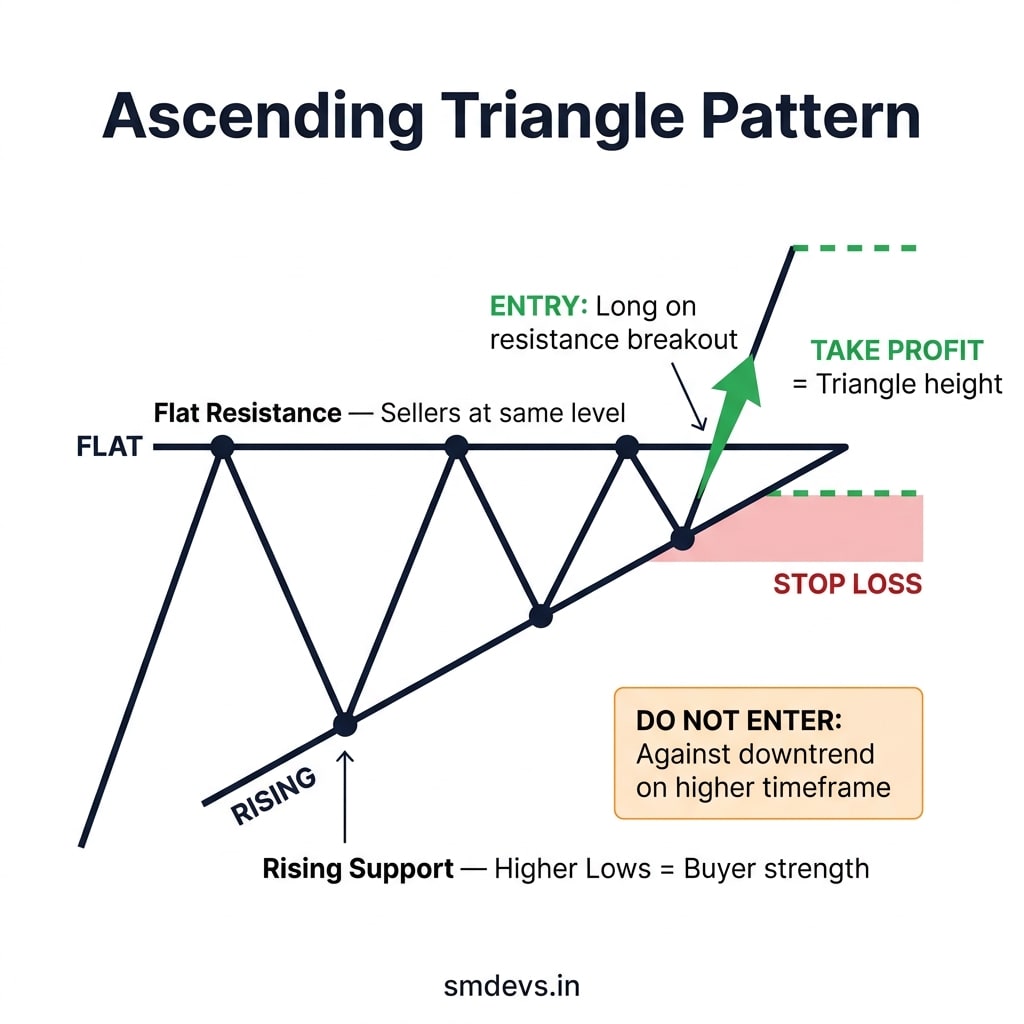
Ascending Triangle Pattern — Entry, Exit & Stop Loss Guide
How to identify an Ascending Triangle, when to enter on the breakout, where to place your stop, and when not to trade it.
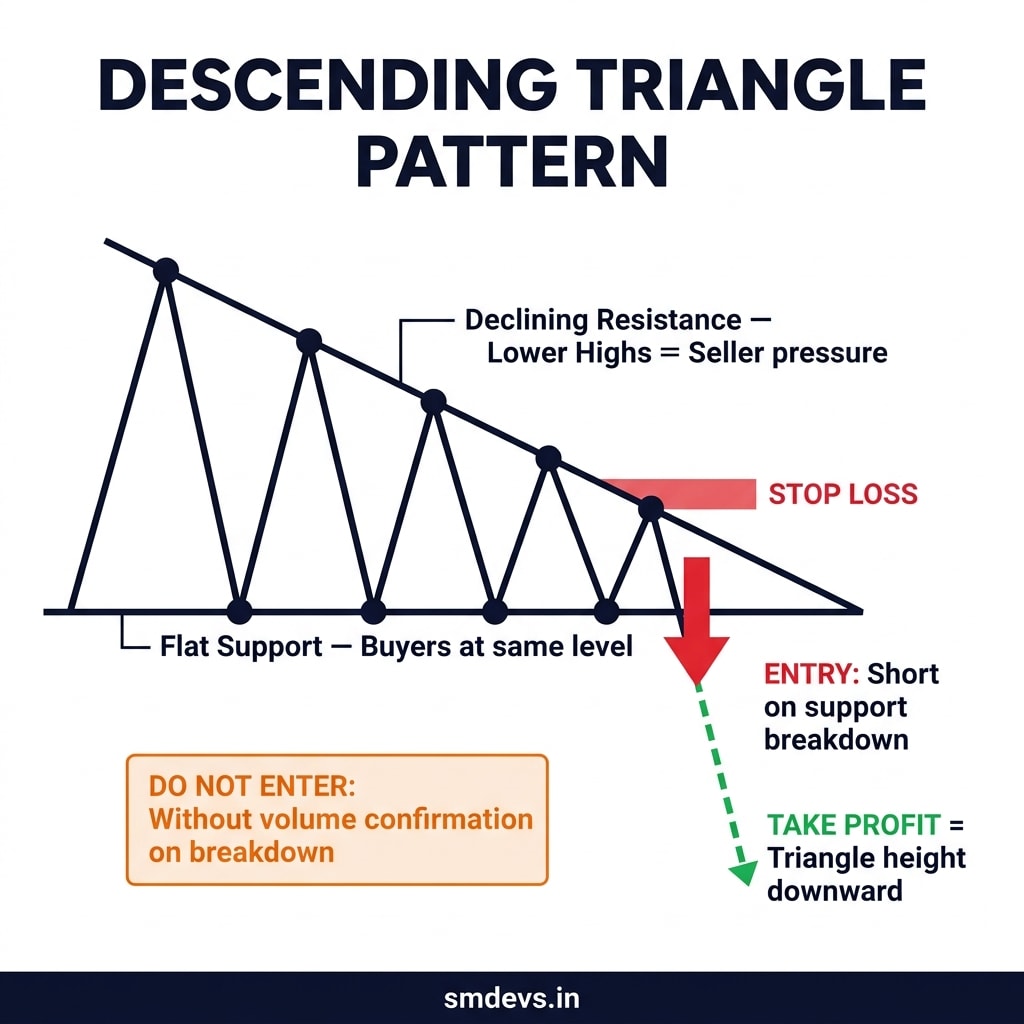
Descending Triangle Pattern — Entry, Exit & Stop Loss Guide
How to identify a Descending Triangle, when to enter short on the breakdown, where to set your stop, and what invalidates it.
Need Help Growing Your Website?
Use our free SEO tools to audit and optimize your site — no signup required.