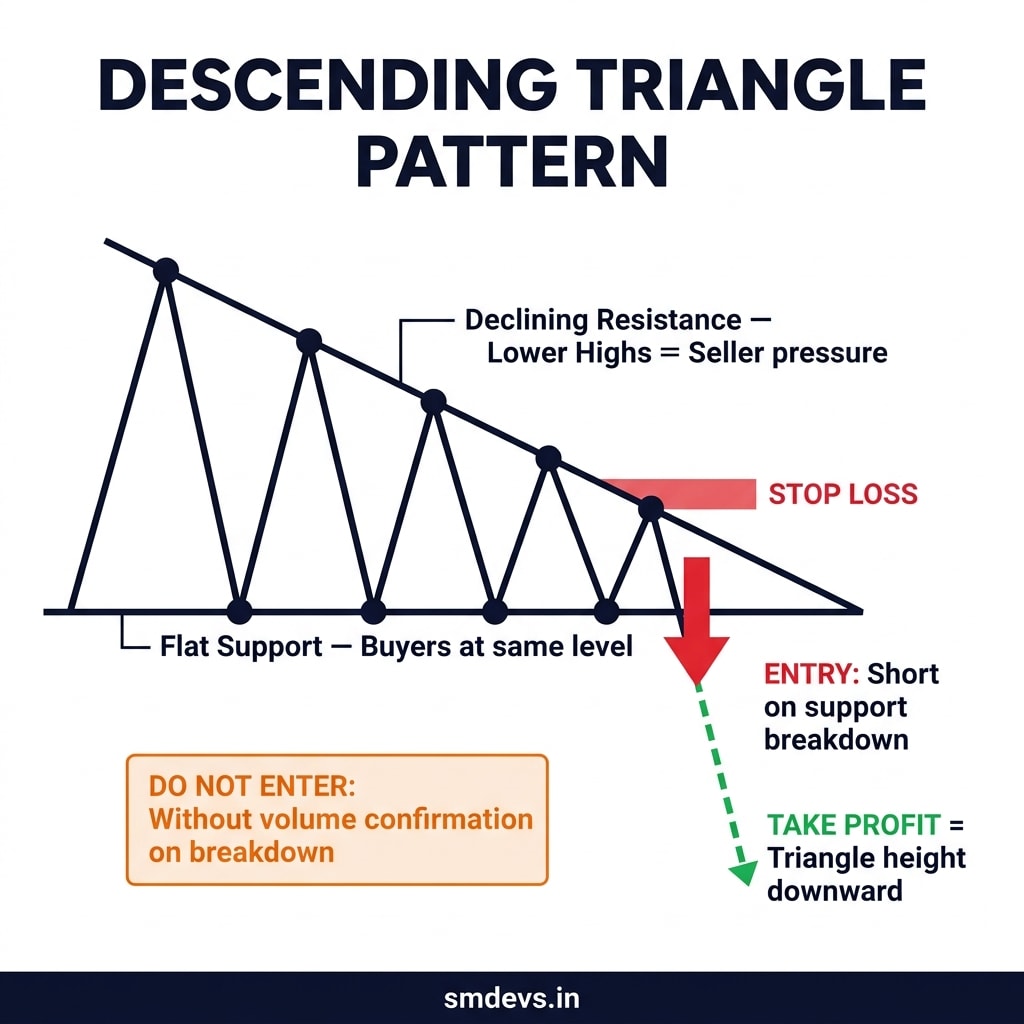
Descending Triangle Pattern — Entry, Exit & Stop Loss Guide
How to identify a Descending Triangle, when to enter short on the breakdown, where to set your stop, and what invalidates it.
Click to open full-screen view · Free to share with attribution
About This Infographic
The Descending Triangle is a bearish pattern formed by two structural signals: a flat horizontal support where buyers keep defending the same level, and a declining resistance where sellers make progressively lower highs — signaling growing seller pressure. This infographic shows how to identify both trendlines, the confirmed breakdown entry below flat support with volume, stop loss above the last lower high, triangle-height measured move downward target, and the invalidation signal — a breakdown on low volume has a significantly higher failure rate and should be avoided.
Related Infographics
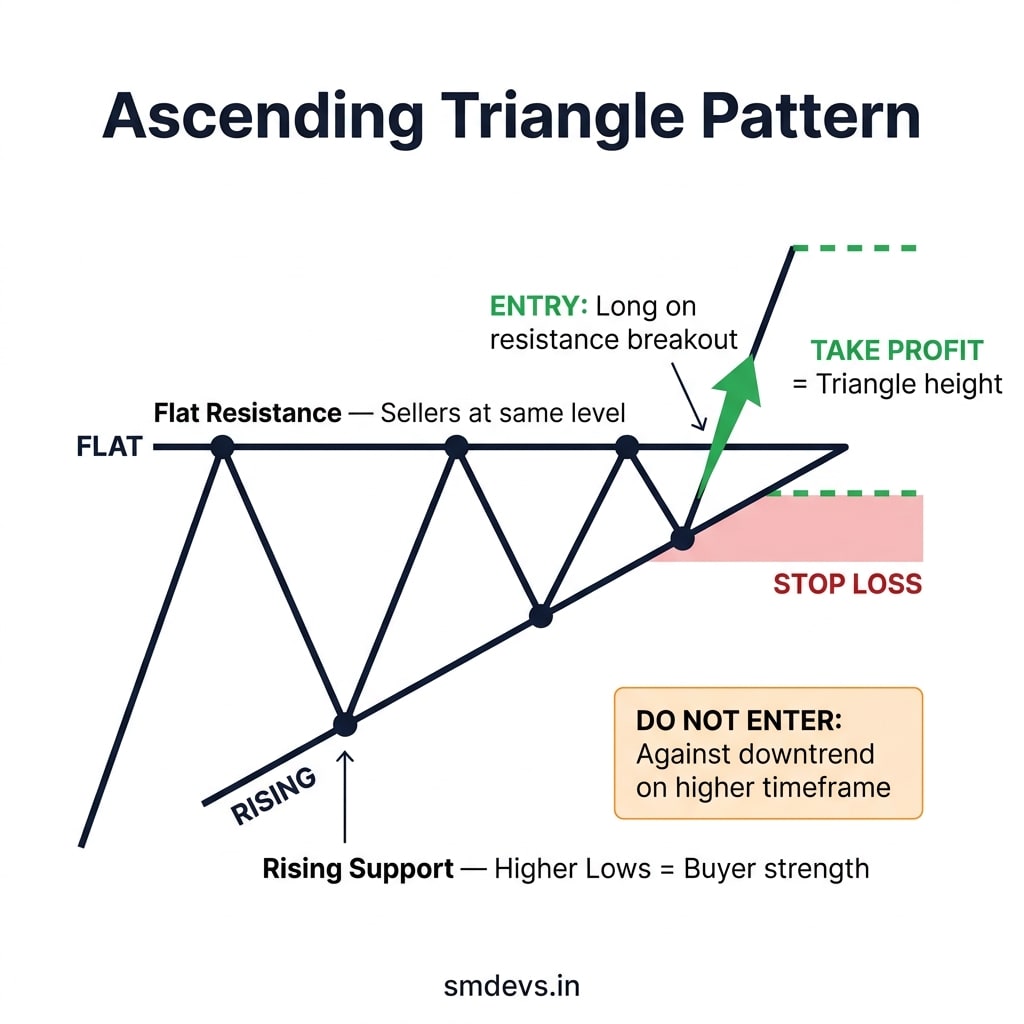
Ascending Triangle Pattern — Entry, Exit & Stop Loss Guide
How to identify an Ascending Triangle, when to enter on the breakout, where to place your stop, and when not to trade it.
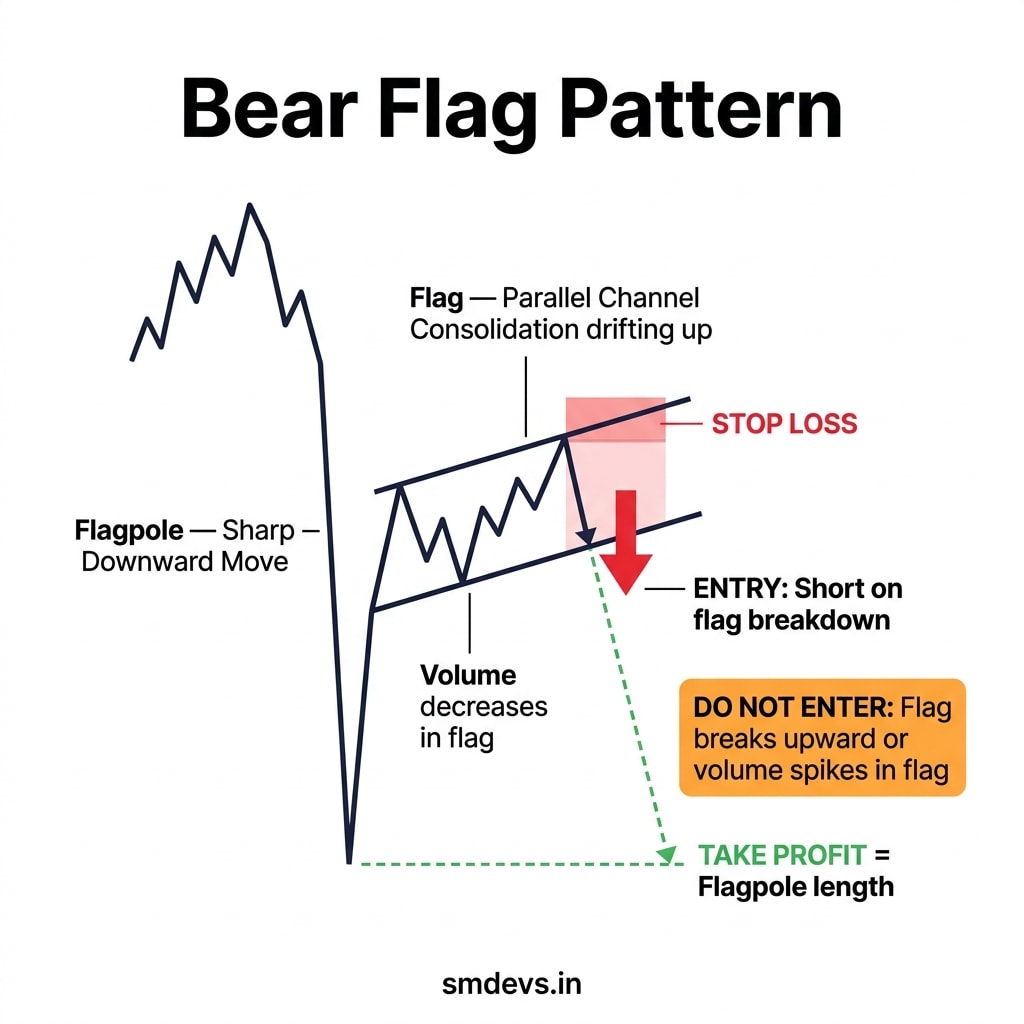
Bear Flag Pattern — Entry, Exit & Stop Loss Guide
How to identify a Bear Flag, when to enter short on the breakdown, where to set your stop, and what invalidates the pattern.
Need Help Growing Your Website?
Use our free SEO tools to audit and optimize your site — no signup required.