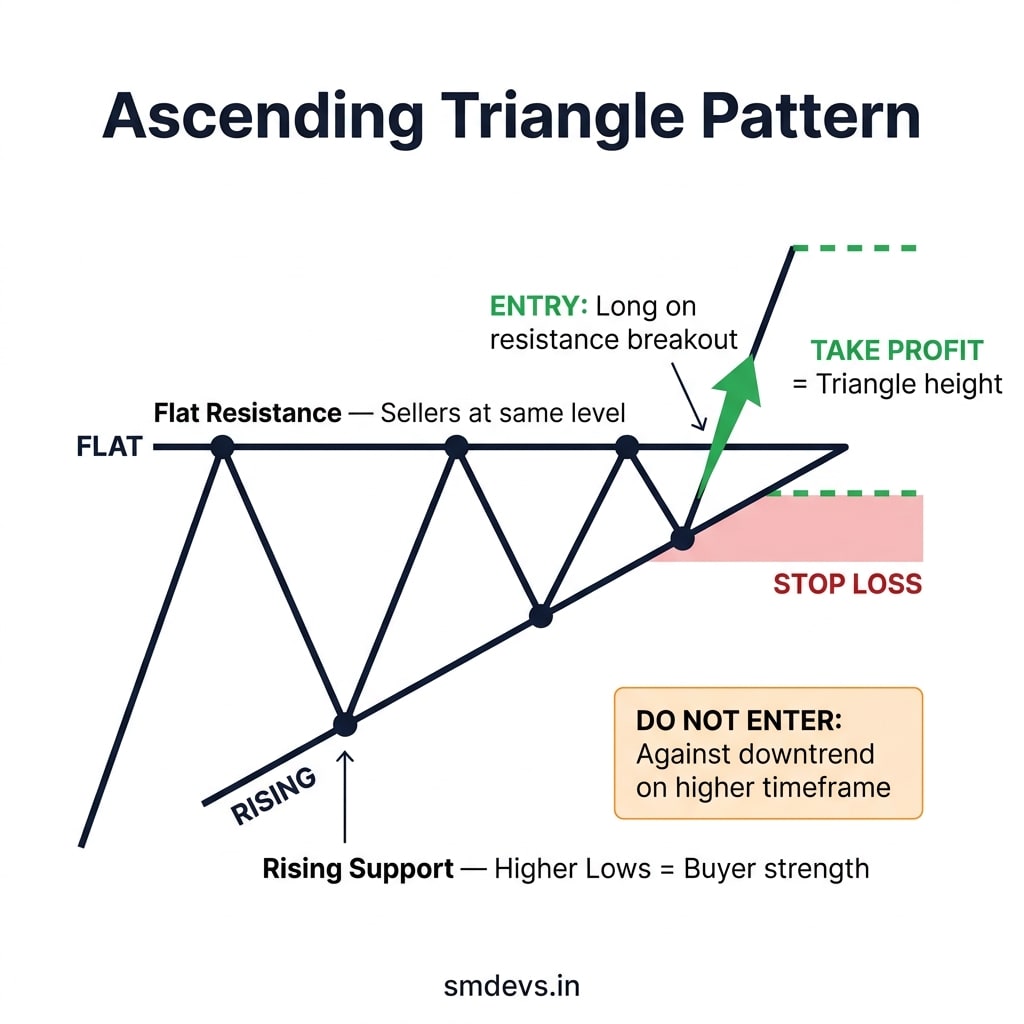
Ascending Triangle Pattern — Entry, Exit & Stop Loss Guide
How to identify an Ascending Triangle, when to enter on the breakout, where to place your stop, and when not to trade it.
Click to open full-screen view · Free to share with attribution
About This Infographic
The Ascending Triangle is a bullish continuation pattern built from two structural signals: a flat horizontal resistance where sellers keep defending the same level, and a rising support line where buyers make progressively higher lows — signaling growing buyer strength. This infographic shows how to identify both trendlines with minimum 2 touches each, the confirmed breakout entry above flat resistance, stop loss below the last higher low, triangle-height measured move target, and the critical context rule — never trade this bullish pattern against a dominant downtrend on the higher timeframe.
Related Infographics
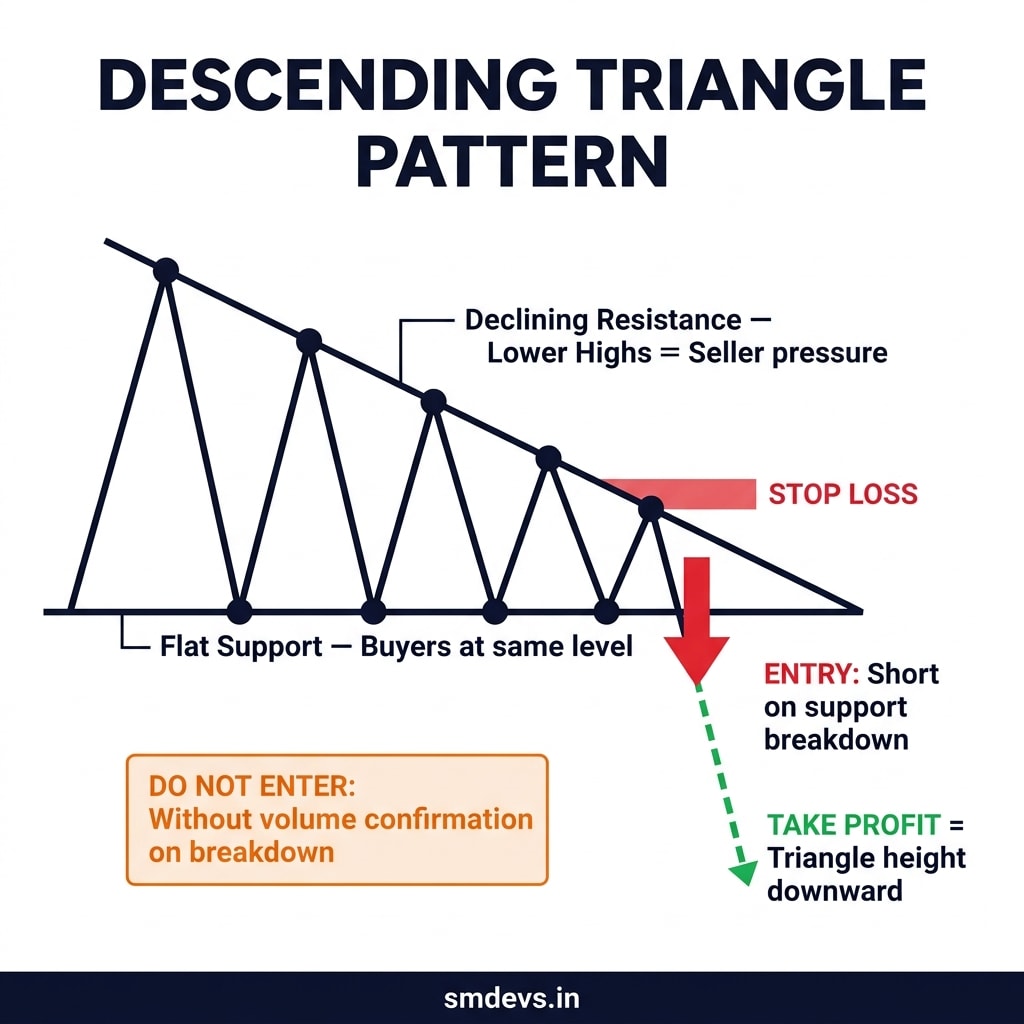
Descending Triangle Pattern — Entry, Exit & Stop Loss Guide
How to identify a Descending Triangle, when to enter short on the breakdown, where to set your stop, and what invalidates it.
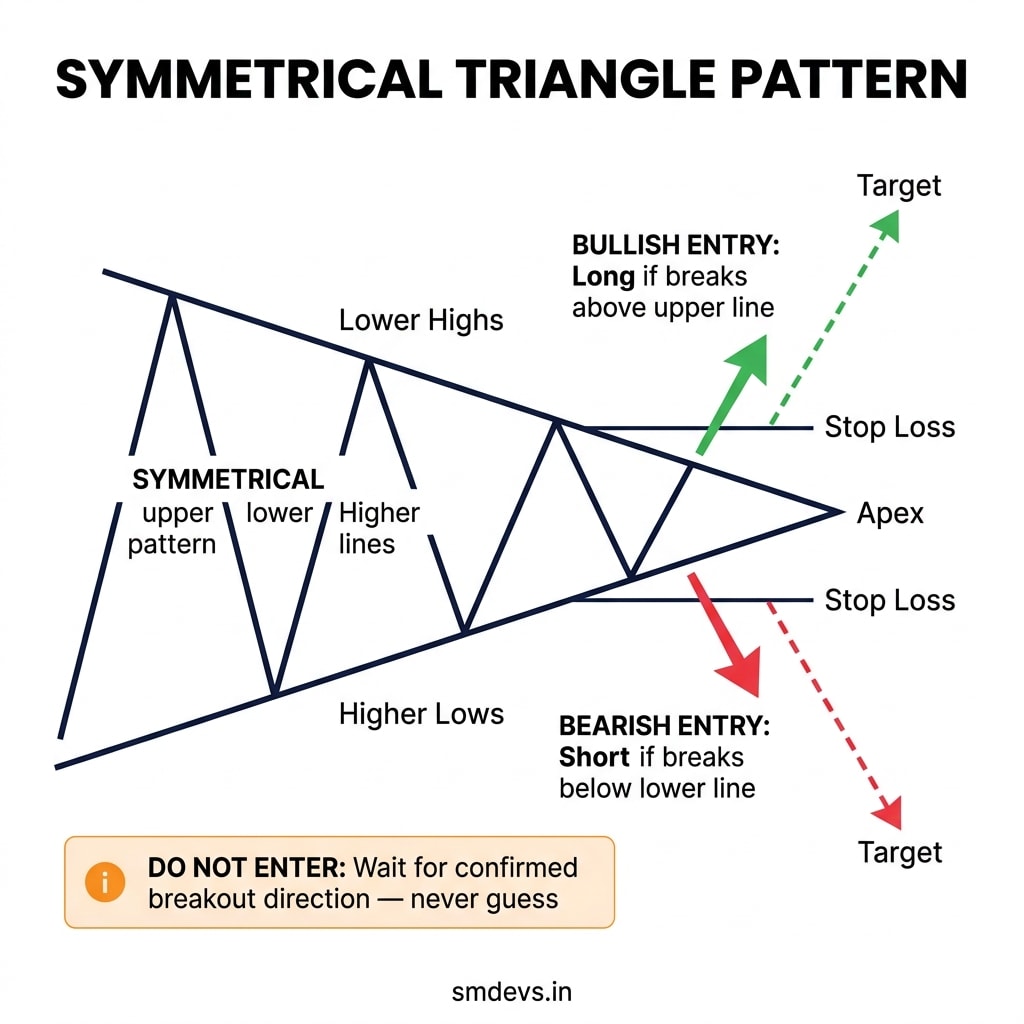
Symmetrical Triangle Pattern — Entry, Exit & Stop Loss Guide
How to identify a Symmetrical Triangle, how to trade both bullish and bearish breakouts, and why guessing the direction is the #1 mistake.
Need Help Growing Your Website?
Use our free SEO tools to audit and optimize your site — no signup required.