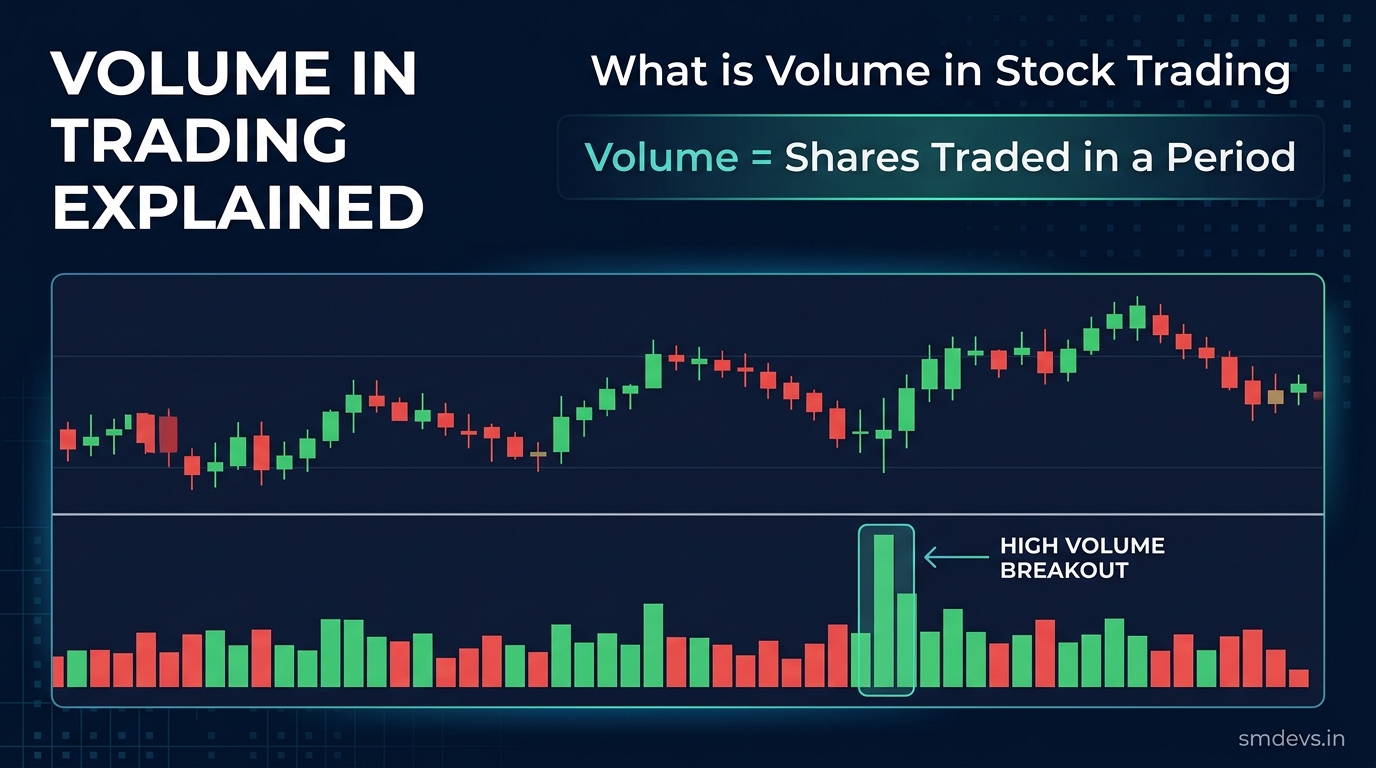
Key Takeaways
- Trading volume is the total number of shares traded in a given period. It's one of the most important indicators in technical analysis. This guide explains how to read volume, interpret price-volume relationships, and use volume to make better trading decisions.
What is Volume in Trading?
Volume is the total number of shares (or contracts) that changed hands during a specific period — a minute, an hour, a day, or a week. It measures trading activity and the strength of price moves.
Volume is represented as bars at the bottom of price charts — green bars on up days, red bars on down days.
Why Volume Matters
Price moves on high volume are significant. Price moves on low volume may be noise. Volume is the "proof" behind a price move:
- High volume = conviction behind the move (buyers or sellers mean it)
- Low volume = weak move, likely to reverse
- Rising price + rising volume = strong uptrend confirmation
- Rising price + falling volume = weak uptrend, potential reversal ahead
Key Volume Concepts
Volume Spike
An unusually large volume bar — often 2–5× the average. Signals significant interest: could be a breakout, institutional buying/selling, earnings announcement, or news event. Always investigate why.
Average Volume
The baseline — typically 20-day average volume. Compare current volume to the average. Volume 2× average on a breakout = strong signal. Volume 0.5× average = weak signal.
Accumulation Days
High-volume up days where institutional investors (mutual funds, FIIs) are building positions. Multiple accumulation days in a stock = bullish sign.
Distribution Days
High-volume down days where institutions are selling. Multiple distribution days in a major index = potential market correction ahead.
Price-Volume Relationships
| Price | Volume | Interpretation |
|---|---|---|
| Rising | Rising | Strong uptrend — bullish ✅ |
| Rising | Falling | Weak uptrend — potential reversal ⚠️ |
| Falling | Rising | Strong downtrend — bearish ❌ |
| Falling | Falling | Weak downtrend — potential bounce ⚠️ |
Volume-Based Indicators
On-Balance Volume (OBV)
Running total that adds volume on up days and subtracts on down days. Rising OBV = accumulation. Falling OBV = distribution. OBV divergence from price can predict reversals.
Volume Moving Average
A 20-period moving average of volume. Helps identify unusually high or low volume days relative to the recent average.
Volume Profile
Shows at which price levels the most volume was traded. High-volume price nodes act as strong support/resistance levels.
Using Volume to Confirm Breakouts
A breakout above resistance is much more reliable when accompanied by high volume:
- Identify resistance level
- Wait for price to break above with volume 1.5–2× the average
- Enter long after confirmation close
- If breakout occurs on low volume, wait for retest with higher volume
Common Volume Mistakes
- Ignoring volume and looking only at price
- Not comparing to average (a "high" bar must be compared to recent history)
- Ignoring volume on breakouts — the most common trading mistake
- Misinterpreting low-volume dips in strong uptrends (healthy pullbacks)


