Key Takeaways
- The Stochastic Oscillator is a momentum indicator comparing a closing price to its price range over a period. This guide explains how it's calculated, how to read %K and %D lines, overbought/oversold zones, and practical trading strategies using the Stochastic.
What is the Stochastic Oscillator?
The Stochastic Oscillator is a momentum indicator developed by George Lane in the 1950s. It compares a security's closing price to its price range over a specific period, generating a value between 0 and 100.
The core idea: In an uptrend, prices tend to close near the high. In a downtrend, they tend to close near the low. When this relationship breaks down, a reversal may be near.
Stochastic Oscillator Calculation
The indicator has two lines:
- %K (Fast Stochastic): = (Close − Lowest Low(n)) / (Highest High(n) − Lowest Low(n)) × 100
- %D (Slow Stochastic): 3-period moving average of %K (smoother, more reliable for signals)
Default setting: n = 14 periods. On a daily chart, that's 14 trading days.
Reading the Stochastic
Overbought Zone (Above 80)
When the stochastic is above 80, the security has been closing near its highs — momentum is strong but may be nearing exhaustion. In a strong uptrend, readings can stay above 80 for extended periods (don't sell just because it's above 80).
Oversold Zone (Below 20)
When below 20, the security has been closing near its lows. Potential for a bounce, especially in an overall uptrending market.
Stochastic Trading Signals
Signal 1: Crossover
- Buy signal: %K crosses above %D in the oversold zone (below 20)
- Sell signal: %K crosses below %D in the overbought zone (above 80)
These crossovers are more reliable than just entering when the reading hits 80 or 20.
Signal 2: Divergence
- Bullish divergence: Price makes lower lows, but Stochastic makes higher lows → potential upside reversal
- Bearish divergence: Price makes higher highs, but Stochastic makes lower highs → potential downside reversal
Divergence signals are among the most powerful and reliable in technical analysis.
Fast Stochastic vs Slow Stochastic
The Fast Stochastic uses raw %K. The Slow Stochastic smooths %K with a 3-period MA (making it %D), and then generates a second smoothed line. Most traders prefer the Slow Stochastic as it generates fewer false signals.
Combining Stochastic with Other Indicators
- Stochastic + RSI: Both oversold = strong buy signal; both overbought = strong sell signal
- Stochastic + MACD: Use MACD for trend direction, Stochastic for entry timing within the trend
- Stochastic + Support/Resistance: Stochastic oversold at key support = high-probability buy signal
Best Settings for Different Markets
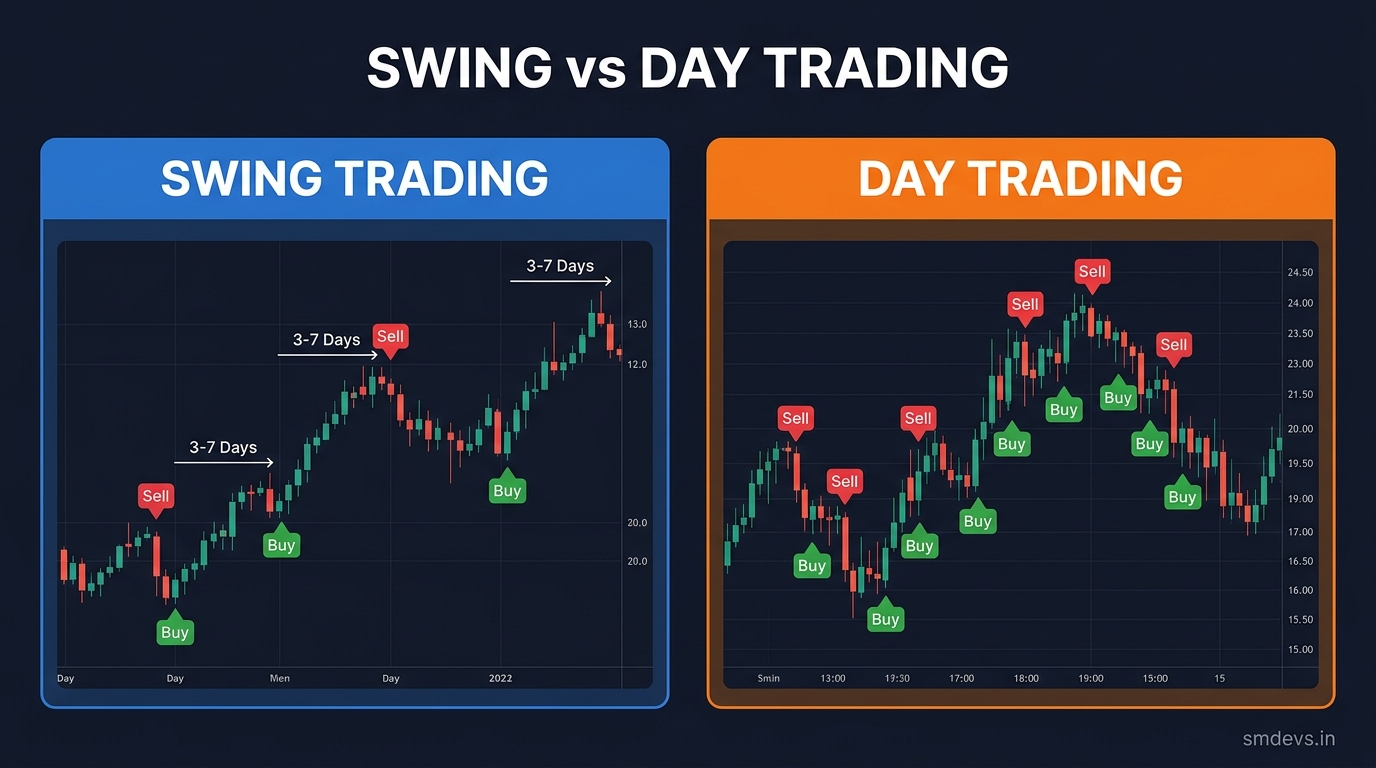
- Intraday trading: 5,3,3 or 14,3,3 settings; shorter periods for faster signals
- Swing trading: 14,3,3 (default) on daily charts
- Position trading: 21,7,7 or 14,5,5 on weekly charts for longer-term signals


