Key Takeaways
- Pivot points are one of the most widely used technical analysis tools for identifying key support and resistance levels in intraday trading. Calculated purely from the previous session's High, Low, an
What is a Pivot Point in Trading?
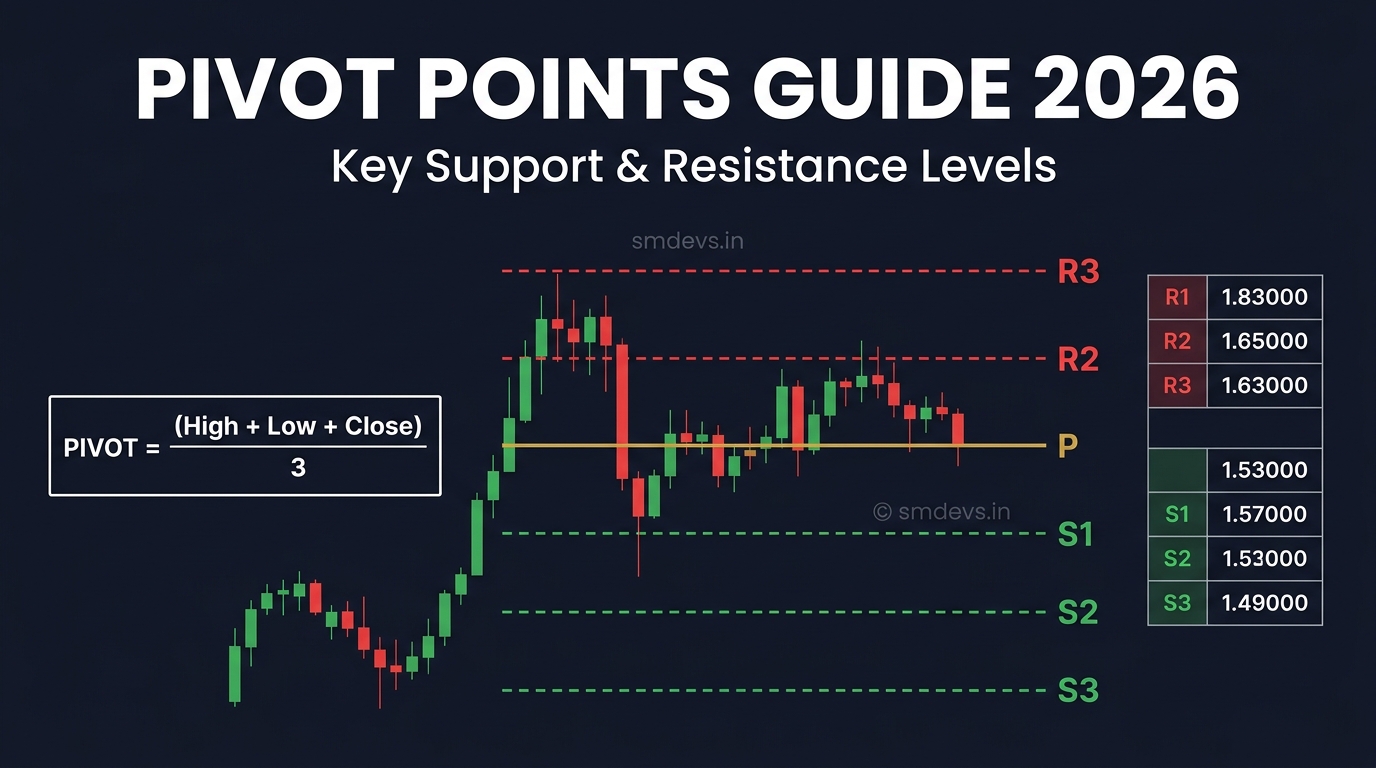
A pivot point is a technical analysis price level calculated from the previous trading session's high, low, and closing prices. It represents the average of these three key prices and serves as the central equilibrium point for a trading session — above which the market is considered bullish, and below which it is considered bearish.
Pivot points are unique because they are objective, formula-driven levels — unlike support and resistance drawn by individual traders which can vary widely. Because thousands of traders use the same pivot point calculations simultaneously, these levels often become self-fulfilling prophecies where price actually reacts at the calculated levels.
Use our free Pivot Point Calculator to instantly calculate all pivot levels for any stock or index.
Pivot Point Formula: How to Calculate Pivot Points
The classic (Standard) pivot point is calculated as:
Pivot Point (P) = (Previous High + Previous Low + Previous Close) / 3
Once you have the Pivot Point, you calculate three resistance levels (R1, R2, R3) and three support levels (S1, S2, S3):
| Level | Formula | Description |
|---|---|---|
| R3 (Resistance 3) | High + 2×(P − Low) | Extreme resistance — rare visits |
| R2 (Resistance 2) | P + (High − Low) | Strong resistance level |
| R1 (Resistance 1) | 2×P − Low | First resistance above pivot |
| P (Pivot Point) | (H + L + C) / 3 | Central equilibrium level |
| S1 (Support 1) | 2×P − High | First support below pivot |
| S2 (Support 2) | P − (High − Low) | Strong support level |
| S3 (Support 3) | Low − 2×(High − P) | Extreme support — rare visits |
Worked Example: Calculating Nifty 50 Pivot Points
Let's say yesterday's Nifty 50 session had:
- High: 24,750
- Low: 24,350
- Close: 24,580
Step 1: P = (24,750 + 24,350 + 24,580) / 3 = 24,560
Step 2:
- R1 = 2 × 24,560 − 24,350 = 24,770
- R2 = 24,560 + (24,750 − 24,350) = 24,960
- R3 = 24,750 + 2 × (24,560 − 24,350) = 25,170
- S1 = 2 × 24,560 − 24,750 = 24,370
- S2 = 24,560 − (24,750 − 24,350) = 24,160
- S3 = 24,350 − 2 × (24,750 − 24,560) = 23,970
Save time by using our free Pivot Point Calculator — enter any stock's previous High, Low, and Close to instantly get all 7 levels.
Types of Pivot Points
| Type | Best For | Key Characteristic |
|---|---|---|
| Standard (Classic) | Most traders; indices, large caps | Simple H+L+C average — most widely watched |
| Fibonacci Pivot | Swing traders; forex traders | Uses Fibonacci ratios (38.2%, 61.8%) for S/R levels |
| Camarilla Pivot | Intraday scalpers | Tighter levels closer to price; L3/L4/H3/H4 as reversal zones |
| Woodie's Pivot | Range traders | Gives more weight to the closing price |
| DeMark's Pivot | Advanced traders | Uses conditional formula based on Open vs Close relationship |
For most Indian equity traders (NSE/BSE), the Standard Pivot Point is the most reliable because it is the most watched — making its levels the most significant.
How to Trade Using Pivot Points
Strategy 1: Pivot as Trend Bias Filter
- Price above Pivot (P): Bullish bias for the session → look for BUY opportunities at S1 support with target at R1
- Price below Pivot (P): Bearish bias for the session → look for SELL opportunities at R1 resistance with target at S1
Strategy 2: Bounce Trading at S1/R1
S1 and R1 are the most reliable levels for intraday bounce trades:
- Wait for price to approach S1 (in an uptrend session)
- Look for bullish candlestick confirmation (hammer, bullish engulfing) at S1
- Enter long with stop loss below S2
- Target: Pivot Point (P) first, then R1
Strategy 3: Breakout Trading
- If price breaks and closes above R1 with strong volume → momentum buy targeting R2
- If price breaks and closes below S1 with volume → momentum sell targeting S2
- Always confirm breakouts with volume — low-volume breakouts have high failure rates
Strategy 4: Pivot for Stop Loss Placement
Pivot levels make excellent stop loss references:
- Long trade above Pivot → stop loss just below S1
- Short trade below Pivot → stop loss just above R1
- This gives you a mathematically defined stop that aligns with the most-watched market levels
Pivot Points for Day Trading: Best Practices
- Calculate before market opens: Pivot levels are fixed for the entire session — calculate at 9:00 AM using previous day's OHLC data
- Mark all 7 levels on your chart: Most trading platforms (Zerodha Kite, TradingView, Upstox) have built-in pivot point indicators
- R1 and S1 are the most important: 70–80% of trading days see prices stay between R1 and S1 — focus here first
- Combine with volume: A rejection at R1 with high volume is far more reliable than a quiet, low-volume touch
- Weekly and monthly pivots: For swing traders, weekly pivot points (calculated from last week's H/L/C) provide excellent multi-day S/R levels
Pivot Points for Scalping (Best Risk Reward Ratio)
Pivot points are particularly popular for scalping due to their precision:
- Use Camarilla pivots for scalping — the H3/L3 levels provide excellent mean-reversion scalp setups
- Scalp entry at H3 (short) or L3 (long) with tight stops at H4/L4 respectively
- Target: back to pivot (P) — this gives a natural 2:1 to 3:1 risk-reward ratio on scalp trades
- Time frames: 1-minute to 5-minute charts for execution; 15-minute chart for context
For the best risk reward ratio for scalping, aim for minimum 1.5:1 — risk ₹500 to make ₹750+. Pivot points between H3 and L3 naturally create these setups because the levels are statistically proven zones.
Free Pivot Point Calculator
Manually calculating pivot points for multiple stocks every morning is time-consuming. Use our free Pivot Point Calculator to:
- Calculate all 7 Standard pivot levels instantly
- Switch between Standard, Fibonacci, and Camarilla formulas
- Calculate for any stock, index, or commodity
- Use for daily, weekly, or monthly timeframes
FAQs: Pivot Points in Trading
What is a pivot point in trading?
A pivot point is a price level calculated from the previous session's High, Low, and Close prices using the formula P = (H + L + C) / 3. It acts as the key equilibrium level for the trading session — price above it is bullish, price below it is bearish. Traders use the related support (S1, S2, S3) and resistance (R1, R2, R3) levels for entries, exits, and stop losses.
How accurate are pivot points?
Pivot points are not always accurate — no indicator is. However, they are statistically significant because millions of traders globally use the same calculation, making these levels self-reinforcing. Studies show that price reacts at pivot levels 60–70% of the time in liquid markets like Nifty 50 and Bank Nifty.
Which pivot point type is best for day trading in India?
Standard (Classic) pivot points are the most widely used for NSE/BSE day trading because they are the most watched. Camarilla pivots are preferred by scalpers due to tighter levels. For Bank Nifty intraday trading, Standard pivots on the daily timeframe are the industry standard.
What is the best risk reward ratio for scalping with pivot points?
For scalping with Camarilla pivot points, a 1.5:1 to 2:1 risk-reward ratio is achievable and sustainable. Risk at L4/H4 (stop) and target L3/H3 (entry) to P (target) gives clean, defined risk. Never scalp with less than 1:1 risk-reward — the win rate must compensate for transaction costs.


