Key Takeaways
- The Price-to-Earnings (P/E) ratio is the most widely used stock valuation metric worldwide. It tells you how much the market is paying for every ₹1 of a company's earnings. This complete guide explain
What is the P/E Ratio?
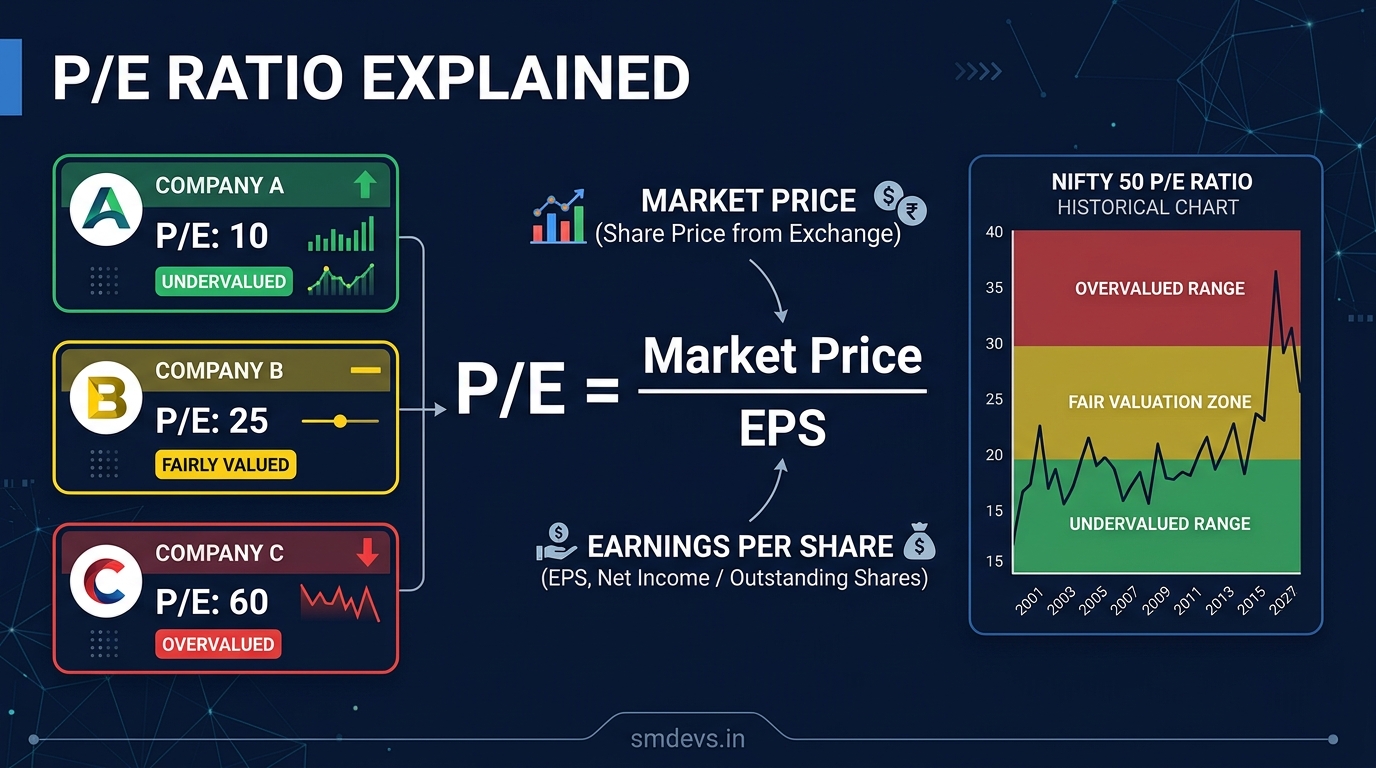
The Price-to-Earnings (P/E) ratio compares a company's current stock price to its earnings per share (EPS). It tells you how many years' worth of current earnings you are paying for when you buy the stock today — or simply, the market's valuation multiple on the company's profits.
Formula: P/E = Market Price per Share / Earnings Per Share (EPS)
Example: A stock trading at ₹500 with EPS of ₹25 → P/E = 500/25 = 20x. Investors are paying ₹20 for every ₹1 of annual earnings.
Types of P/E Ratio
Trailing P/E (TTM — Trailing Twelve Months)
Uses actual EPS from the past 12 months of reported earnings. Based on real, confirmed data. The most commonly quoted P/E on financial portals (Screener.in, Moneycontrol, NSE website).
Forward P/E
Uses estimated EPS for the next 12 months (analyst forecasts). Useful when a company's earnings are expected to grow significantly. Forward P/E being lower than trailing P/E indicates expected earnings growth.
Shiller P/E (CAPE — Cyclically Adjusted Price to Earnings)
Uses average inflation-adjusted EPS over 10 years to smooth out business cycle distortions. Used for index-level valuation assessment. Less applicable for individual stock analysis.
How to Interpret P/E Values
| P/E Range | General Interpretation | Caution |
|---|---|---|
| Below 10x | Very cheap — deep value OR serious problems | Investigate why: debt, declining business, accounting issues? |
| 10–15x | Value zone — typical for mature, slow-growth businesses | May be cheap for quality or expensive for declining earnings |
| 15–25x | Fair value — moderate growth expected | Most large-cap quality stocks in India trade here |
| 25–40x | Growth premium — market expects strong earnings growth | Justified only if growth materialises; risky if it doesn't |
| Above 40–50x | Expensive — very high growth expectations | Small miss on earnings can cause severe de-rating |
| Negative P/E | Company reporting losses | P/E not meaningful; use EV/Revenue or Price/Sales instead |
Critical rule: P/E is meaningless in isolation. Always compare to: (1) the same company's historical P/E, (2) industry peers' P/E, (3) the overall market P/E.
P/E by Sector: Why Comparison Context is Everything
Different industries command very different P/E multiples because their growth rates, capital intensity, and earnings visibility differ:
| Sector | Typical P/E Range (India) | Why |
|---|---|---|
| FMCG (HUL, ITC, Nestle) | 40–70x | Predictable earnings, pricing power, premium brand value |
| IT Services (TCS, Infosys) | 25–35x | High margins, dollar revenues, scalable business models |
| Banks (HDFC Bank, ICICI) | 15–25x | Asset-heavy, regulated returns, P/B often preferred metric |
| Auto (Maruti, M&M) | 20–30x | Cyclical, capital-intensive |
| Pharma (Sun Pharma, Dr Reddy's) | 25–35x | R&D pipeline drives growth; regulatory risk |
| PSU Banks (SBI, Bank of Baroda) | 8–12x | Lower ROE, NPA concerns, government ownership discount |
| Metals/Mining (Tata Steel, SAIL) | 5–15x | Highly cyclical commodity earnings |
| Cement (UltraTech, Shree Cement) | 30–50x | Infrastructure growth theme, high pricing power |
Nifty 50 P/E Ratio History: Market Valuation Over Time
The Nifty 50 P/E ratio is one of the best gauges of overall Indian market valuation:
| Period | Nifty P/E Range | Market Phase |
|---|---|---|
| Mar 2020 (COVID crash) | ~18–20x | Extreme fear — historically cheap entry point |
| Dec 2020 (recovery) | ~38–40x | Expensive but justified by low interest rates + recovery optimism |
| 2022 (correction) | ~20–22x | Rate hike correction brought valuations back to fair |
| 2023–2024 (bull run) | ~22–24x | Slightly above historical average; earnings growth supported |
| Aug 2026 (current) | ~22–24x | Near historical average — not extreme either way |
Historical average Nifty 50 P/E: ~20–22x. Below 18x = historically cheap (good buying opportunity). Above 28x = historically expensive (exercise caution, reduce exposure).
Source: NSE India — Market P/E Data
PEG Ratio: P/E Adjusted for Growth
The PEG ratio addresses P/E's biggest weakness — it ignores growth rate.
Formula: PEG = P/E Ratio / Expected EPS Growth Rate (%)
Example: Company A: P/E = 30, EPS growth = 30% → PEG = 1.0 (fairly valued)
Company B: P/E = 30, EPS growth = 10% → PEG = 3.0 (overvalued for its growth)
| PEG Value | Interpretation |
|---|---|
| Below 0.5 | Potentially very undervalued (if growth estimate is realistic) |
| 0.5–1.0 | Undervalued to fairly valued |
| 1.0 | Perfectly fairly valued (P/E matches growth) |
| Above 1.5–2.0 | Expensive for the growth rate |
P/E Ratio Limitations: What It Doesn't Tell You
- EPS can be manipulated: Accounting adjustments (depreciation choices, one-time items) affect EPS without affecting real cash flows. Always check P/E alongside Price/Free Cash Flow.
- Ignores debt: Two companies with same P/E but different debt levels have very different risk profiles. Use EV/EBITDA for capital-structure-neutral comparison.
- Doesn't account for growth: A P/E of 40x may be cheap for a company growing 50% annually. Always adjust for growth (use PEG).
- Not useful for loss-making companies: Use Price/Sales or EV/Revenue instead.
- Different accounting standards: International comparisons can be misleading due to accounting differences.
Complete Stock Valuation Framework: P/E + Other Ratios
Never use P/E alone. Combine it with:
- P/B Ratio: Best for asset-heavy businesses (banks, real estate)
- EV/EBITDA: Capital-structure neutral; ignores debt and depreciation
- Price/Free Cash Flow: Most reliable; can't be as easily manipulated as EPS
- Dividend Yield: Relevant for mature, dividend-paying companies
- ROE (Return on Equity): High P/E + High ROE = justified premium; High P/E + Low ROE = danger
FAQs About P/E Ratio
What is a good P/E ratio for Indian stocks?
There's no universal "good" P/E — it depends entirely on the sector and company's growth rate. As a general rule, for large-cap Indian companies, a P/E of 15–25x is fair, 10–15x may indicate value, and above 40x requires very strong growth justification. Always compare to peers and the company's own history.
What is the current Nifty 50 P/E ratio?
As of August 2026, the Nifty 50 trades at approximately 22–24x trailing earnings — near its historical average of 20–22x. Real-time Nifty P/E data is available free on the NSE India website under Market Data.
Can P/E ratio be negative?
Yes — when a company reports a net loss, EPS is negative, making P/E negative. A negative P/E is meaningless — use other valuation metrics like Price/Sales, EV/Revenue, or Price/Gross Profit for loss-making companies.
Why do some stocks have very high P/E ratios?
High P/E stocks are priced for future growth expectations. If a company is growing earnings at 40% annually, a P/E of 50x may actually be cheap (PEG = 1.25). High P/E becomes dangerous when: growth slows, interest rates rise (discount rate increases), or earnings disappoint.


