Key Takeaways
- Google Search Console (GSC) is a free tool by Google that shows you how your website performs in Google Search — which keywords bring traffic, which pages have indexing errors, Core Web Vitals issues,
What is Google Search Console?
Google Search Console (GSC) is a free web service by Google that helps website owners, SEOs, and developers monitor, maintain, and troubleshoot their site's presence in Google Search results. It's the most authoritative SEO tool available — because the data comes directly from Google, not third-party estimates.
GSC replaced the older "Google Webmaster Tools" in 2015. It's completely free and every website owner should have it set up.
Access at: search.google.com/search-console
How to Set Up Google Search Console
Step 1: Add Your Property
Choose between two property types:
- Domain property (recommended): Covers all URLs across all subdomains and protocols (http/https). Requires DNS verification.
- URL-prefix property: Covers only a specific URL prefix. Multiple verification methods available (HTML file, HTML tag, Google Analytics, Tag Manager).
Step 2: Verify Ownership
For Next.js/Vercel sites, the easiest method:
- Download the HTML verification file from GSC
- Place it in your /public folder
- Deploy → Click Verify in GSC
Alternatively, add the meta tag to your site's <head> via your root layout's metadata export.
Step 3: Submit Your Sitemap
Go to Sitemaps → Enter your sitemap URL (e.g., yourdomain.com/sitemap.xml) → Submit. GSC will begin discovering and indexing your pages.
The 6 Most Important GSC Reports
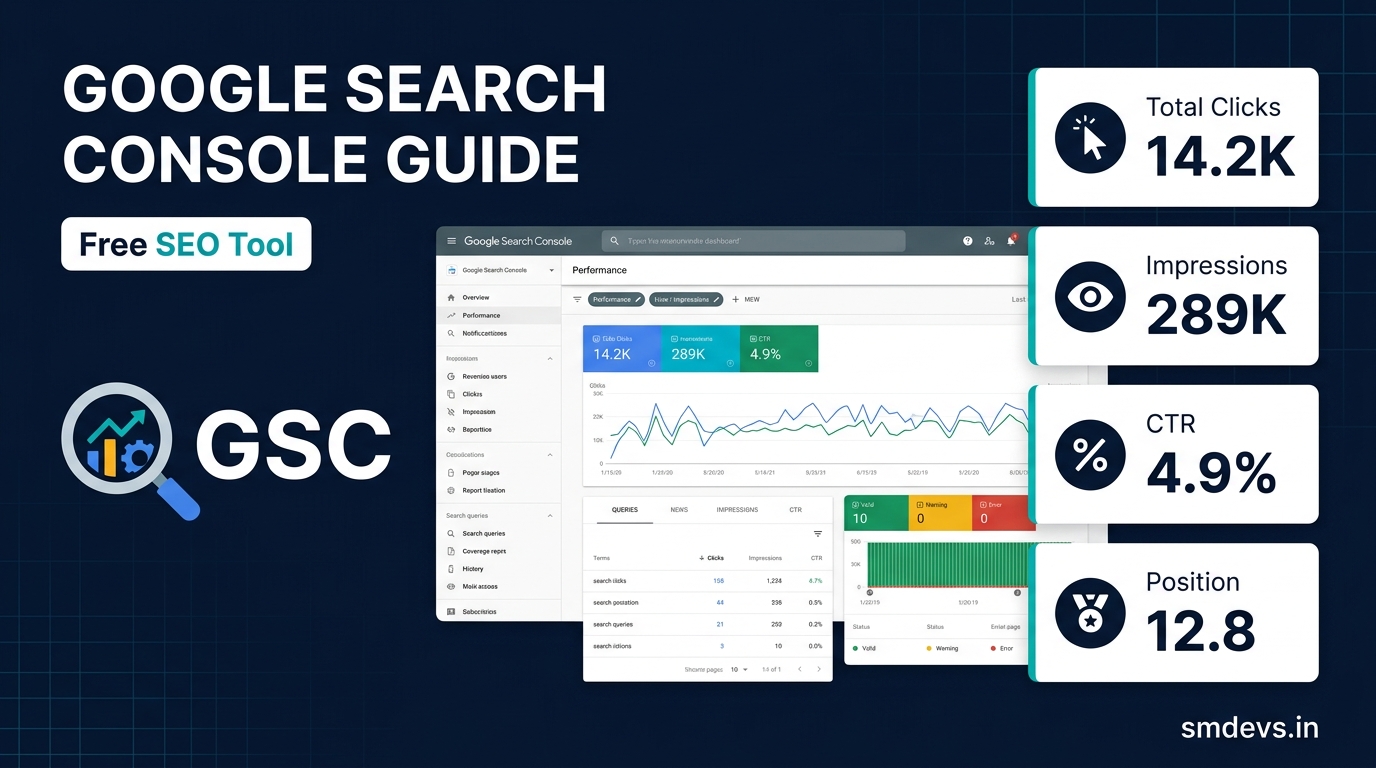
1. Performance Report (The Most Valuable)
Shows how your site performs in Google Search over the last 16 months:
- Total Clicks: Actual visits from Google Search
- Total Impressions: How many times your pages appeared in search results
- Average CTR: Click-Through Rate = Clicks / Impressions. Industry average: 2–5% for most pages
- Average Position: Your average ranking position for all keywords
How to use it:
- Sort by Impressions (high to low) to find high-potential keywords you rank for but aren't clicking through well → optimise title tags and meta descriptions for those pages
- Filter by Position 4–15 to find "near-page-1" keywords worth targeting with content updates
- Filter by Page to find your best-performing content and understand what makes it work
2. Pages (formerly Coverage) Report
Shows which of your pages Google has indexed and which have issues:
- Indexed: Pages successfully in Google's index — good
- Not indexed: Pages Google found but chose not to index. Click each reason for details:
- "Crawled - currently not indexed" → Content may be thin; improve and request reindex
- "Discovered - currently not indexed" → Not yet crawled; may be low-priority or crawl budget issue
- "Duplicate without user-selected canonical" → Add canonical tags
- "Excluded by 'noindex' tag" → Check if intentional
3. Core Web Vitals Report
Shows your pages' performance on Google's user experience metrics (LCP, INP, CLS) for both mobile and desktop:
- Good URLs: All three metrics pass — no action needed
- Need improvement: One metric is borderline — worth optimising
- Poor URLs: Priority fix — these pages have a ranking disadvantage
Click any issue to see the specific pages affected and which metric is failing.
4. Sitemaps Report
Shows your submitted sitemaps and how many URLs were discovered vs indexed. If submitted URLs >> indexed URLs, investigate the Pages report for reasons.
5. Links Report
Shows your backlink profile as Google sees it:
- Top linking sites: Which domains link to you most
- Top linked pages: Which of your pages have the most external links
- Top anchor texts: How sites describe your pages in their links
- Internal links: Which pages on your own site are linked to most often
This is authoritative — use it to identify your strongest pages and find internal link gaps.
6. URL Inspection Tool
Enter any URL on your site to see:
- Whether the URL is indexed and when it was last crawled
- The exact canonical URL Google recognises
- Any structured data detected and errors
- Mobile usability status
- Page fetch result (what Googlebot actually sees)
Use "Request Indexing" after publishing new content or making significant updates to speed up indexation.
GSC Workflow: Weekly SEO Routine
- Check Performance report: Any dramatic drops in clicks or impressions (algorithm update or technical issue)?
- Check Pages report: Any new "Not indexed" errors for pages that should be indexed?
- Check Core Web Vitals: Any new "Poor" pages?
- URL Inspection: Request indexing for new content published this week
- Manual Actions: Check for any Google penalties (rare but important)
Advanced GSC Techniques
Find CTR Optimisation Opportunities
- Performance report → Filter: Position 1–10 (page 1)
- Sort by Impressions (high to low)
- Look for keywords with high impressions but CTR below 5%
- These pages rank well but aren't getting clicks → rewrite their title tags and meta descriptions to be more compelling and click-worthy
Identify Cannibalization
If multiple pages compete for the same keyword, filter Performance by a specific keyword — if 3+ pages show up, you have cannibalisation. Consolidate content or use canonical tags.
Export and Track Historical Data
GSC only shows 16 months of data. Export to Google Sheets regularly using the "Data Studio" (Looker Studio) integration to maintain longer historical records. This is invaluable for year-over-year comparisons.
GSC vs Google Analytics: What's the Difference?
| Feature | Google Search Console | Google Analytics 4 |
|---|---|---|
| Data source | Google Search (pre-click) | Website behaviour (post-click) |
| Shows keywords | Yes (full keyword data) | No (mostly "not provided") |
| Shows rankings | Yes (average position) | No |
| Shows user behaviour | No | Yes (sessions, bounce rate, conversions) |
| Best for | SEO analysis, indexing, keyword research | User experience, conversion, traffic analysis |
Use both together: GSC tells you what's driving traffic from Google; GA4 tells you what users do after they arrive.
Common GSC Errors and How to Fix Them
| Error | Fix |
|---|---|
| Page with redirect | Update internal links/sitemap to point directly to final URL |
| Submitted URL not found (404) | Fix or redirect the broken URL; remove from sitemap |
| Duplicate, Google chose different canonical | Add explicit canonical tag pointing to your preferred URL |
| Crawled - currently not indexed | Improve content quality/length; add internal links from strong pages; request reindex |
| Mobile usability errors | Fix tap targets, font sizes, viewport settings |
| CLS issue detected | Set explicit dimensions on images; avoid inserting content above fold dynamically |
FAQs About Google Search Console
Is Google Search Console free?
Yes — completely free, with no usage limits. Google makes it freely available to all website owners.
How long does it take for GSC data to appear?
GSC data typically has a 2–3 day delay. After adding a new property, it takes 1–2 weeks before meaningful data starts appearing. Full historical data builds over the first month.
Can I see competitors' data in GSC?
No — GSC only shows data for your own verified properties. For competitor analysis, use Ahrefs, SEMrush, or Ubersuggest.
Why are my impressions high but clicks low?
High impressions with low clicks typically means you're ranking on page 1 but your title/meta description isn't compelling enough to earn the click. Optimise your title tag and meta description to be more specific, benefit-focused, and relevant to the search query.