Key Takeaways
- EPS (Earnings Per Share) is the most fundamental measure of a company's profitability on a per-share basis. It is the bedrock of stock valuation — the denominator in the P/E ratio, the growth driver b
What is EPS (Earnings Per Share)?
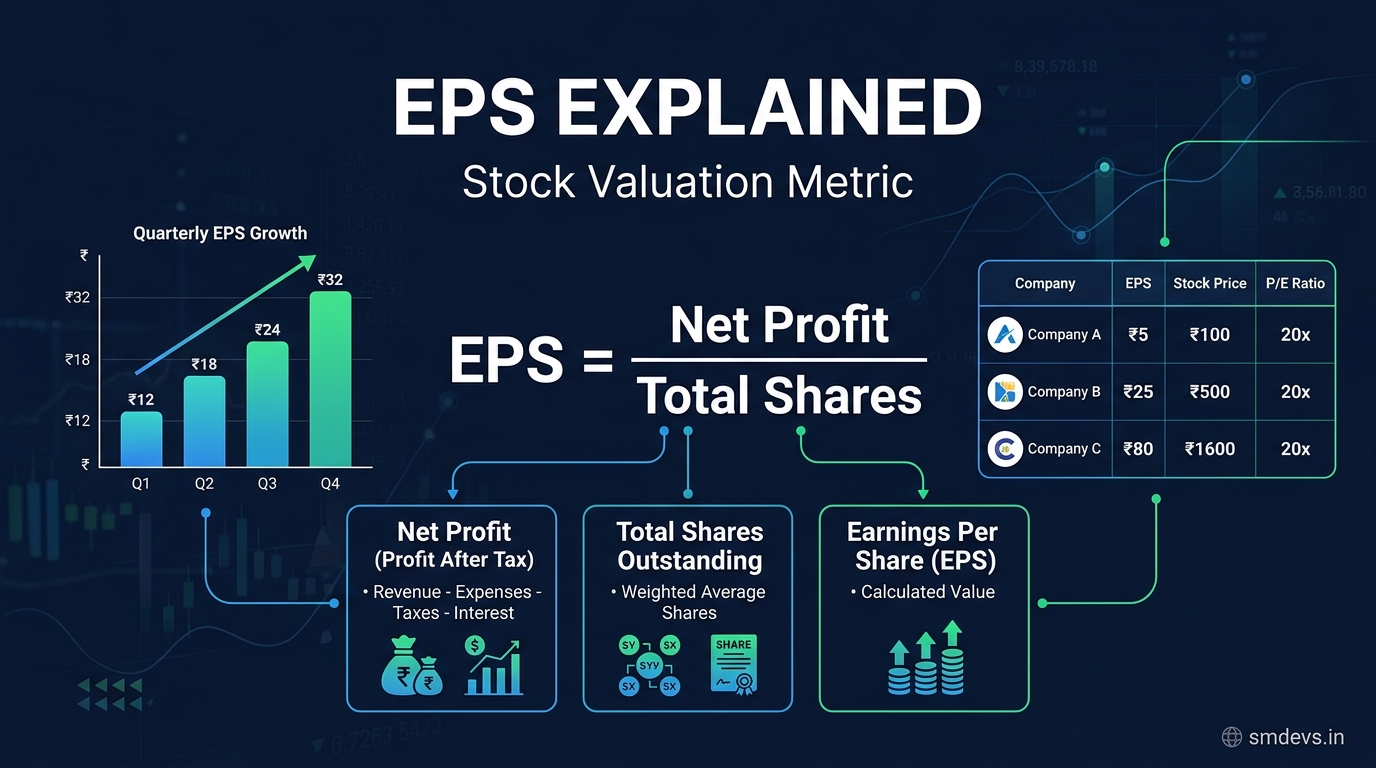
Earnings Per Share (EPS) is the portion of a company's net profit allocated to each outstanding share of common stock. It is the most direct measure of a company's profitability on a per-share basis and is one of the most important metrics in fundamental stock analysis.
Formula: EPS = Net Profit (Profit After Tax) / Weighted Average Number of Shares Outstanding
Example: A company earns ₹500 crore net profit and has 20 crore shares outstanding → EPS = ₹500 crore / 20 crore = ₹25 per share
Basic EPS vs Diluted EPS
| Type | Definition | When to Use |
|---|---|---|
| Basic EPS | Net profit / shares currently outstanding | Simple calculation; most reported figure |
| Diluted EPS | Net profit / (shares outstanding + potential shares from stock options, warrants, convertible bonds) | More conservative; shows what EPS would be if all potential shares were issued |
Always prefer Diluted EPS for analysis — it gives the "worst case" scenario for shareholders by assuming all dilutive instruments are exercised. A large gap between Basic and Diluted EPS signals significant potential dilution ahead.
Trailing EPS vs Forward EPS
- Trailing EPS (TTM): Calculated using actual earnings from the past 12 months. Based on reported, verified data. Available on Screener.in, Moneycontrol, NSE website.
- Forward EPS: Based on analyst estimates for the next 12 months. Reflects expected growth. Used to calculate Forward P/E ratio.
Comparing trailing vs forward EPS tells you the expected earnings growth: if trailing EPS is ₹25 and analysts forecast forward EPS of ₹35, the market is pricing in 40% earnings growth.
How to Analyse EPS for Indian Stocks
1. EPS Growth Rate — Most Critical Factor
A single EPS number is meaningless. What matters is the growth trend:
| Year | EPS | YoY Growth |
|---|---|---|
| FY22 | ₹20 | — |
| FY23 | ₹26 | +30% |
| FY24 | ₹34 | +31% |
| FY25 | ₹45 | +32% |
| FY26 | ₹58 | +29% |
Consistent 25–35% EPS growth over 4–5 years is a hallmark of a compounding machine. Stocks with this trajectory (like Asian Paints in the 2010s, or HDFC Bank historically) tend to be multi-baggers over time.
2. EPS Quality Check
High EPS can be misleading if driven by non-recurring items. Always verify:
- Operating EPS: Strip out one-time gains (asset sales, tax reversals) to see recurring earnings power
- Cash EPS: EPS adjusted for non-cash charges (depreciation, amortisation). Sometimes a better proxy for actual cash generation
- Compare EPS to Cash Flow from Operations: If EPS is high but operating cash flow is poor — investigate. Earnings may not be real cash.
3. EPS and P/E Relationship
EPS is the denominator of the P/E ratio — the most widely used valuation metric:
P/E = Stock Price / EPS
If EPS grows by 30% and the P/E stays constant, the stock price should also appreciate by approximately 30%. This is why EPS growth is the primary driver of long-term stock returns.
When P/E expands alongside EPS growth: Stock returns significantly exceed EPS growth. This is called "P/E re-rating" and happens when a company's quality is being recognised.
4. EPS vs Peers
| Company | EPS (TTM) | Stock Price | P/E | EPS Growth (3Y CAGR) |
|---|---|---|---|---|
| Company A | ₹80 | ₹2,400 | 30x | 25% |
| Company B | ₹15 | ₹600 | 40x | 8% |
| Company C | ₹120 | ₹2,160 | 18x | 30% |
Company C — despite the highest absolute EPS — trades at the lowest P/E with the highest growth. This may represent better value than Company B which has slow growth at a 40x premium.
What Drives EPS Growth?
- Revenue growth: More sales → more profit (assuming margins hold)
- Margin expansion: Higher operating efficiency → more profit from same revenue
- Share buybacks: Reducing the denominator (fewer shares) increases EPS even without profit growth. Tata Consultancy Services (TCS) regularly buybacks shares, boosting EPS.
- Tax benefits: Lower effective tax rate increases PAT and thus EPS
- Deleveraging: Paying off debt reduces interest costs → higher profit → higher EPS
EPS Red Flags
- EPS declining for 2+ consecutive quarters: Business may be structurally challenged
- EPS beats driven by tax reversals or asset sales: Not sustainable; core operations may be weak
- Large Basic vs Diluted EPS gap: Significant pending dilution from ESOPs or convertibles
- EPS growing but revenue declining: Often cost-cutting driven — unsustainable long term
- EPS growth below inflation: Real earnings are actually shrinking
Where to Find EPS Data for Indian Stocks (Free)
- Screener.in — Quarterly and annual EPS, 10-year history, EPS growth charts
- NSE India — Company financials and quarterly results
- Moneycontrol — EPS estimates, analyst forecasts, peer comparison
- BSE India — Official quarterly earnings filings
FAQs: EPS
What is a good EPS for Indian stocks?
There is no universal "good" EPS — it depends entirely on the sector and growth stage. What matters more than absolute EPS is consistent EPS growth (15%+ annually for quality growth stocks), EPS quality (cash-backed, not accounting-driven), and EPS relative to stock price (P/E multiple).
Can EPS be negative?
Yes — a negative EPS means the company is reporting a loss (net profit is negative). Negative EPS doesn't automatically mean avoid the stock — early-stage growth companies (some tech/pharma) may report losses while investing aggressively in future growth. Use revenue growth and cash burn rate instead for such companies.
How often is EPS reported in India?
Indian listed companies report quarterly results (Q1: Apr–Jun, Q2: Jul–Sep, Q3: Oct–Dec, Q4: Jan–Mar). SEBI requires quarterly results to be declared within 45 days of quarter end. Annual EPS is in the company's Annual Report.


