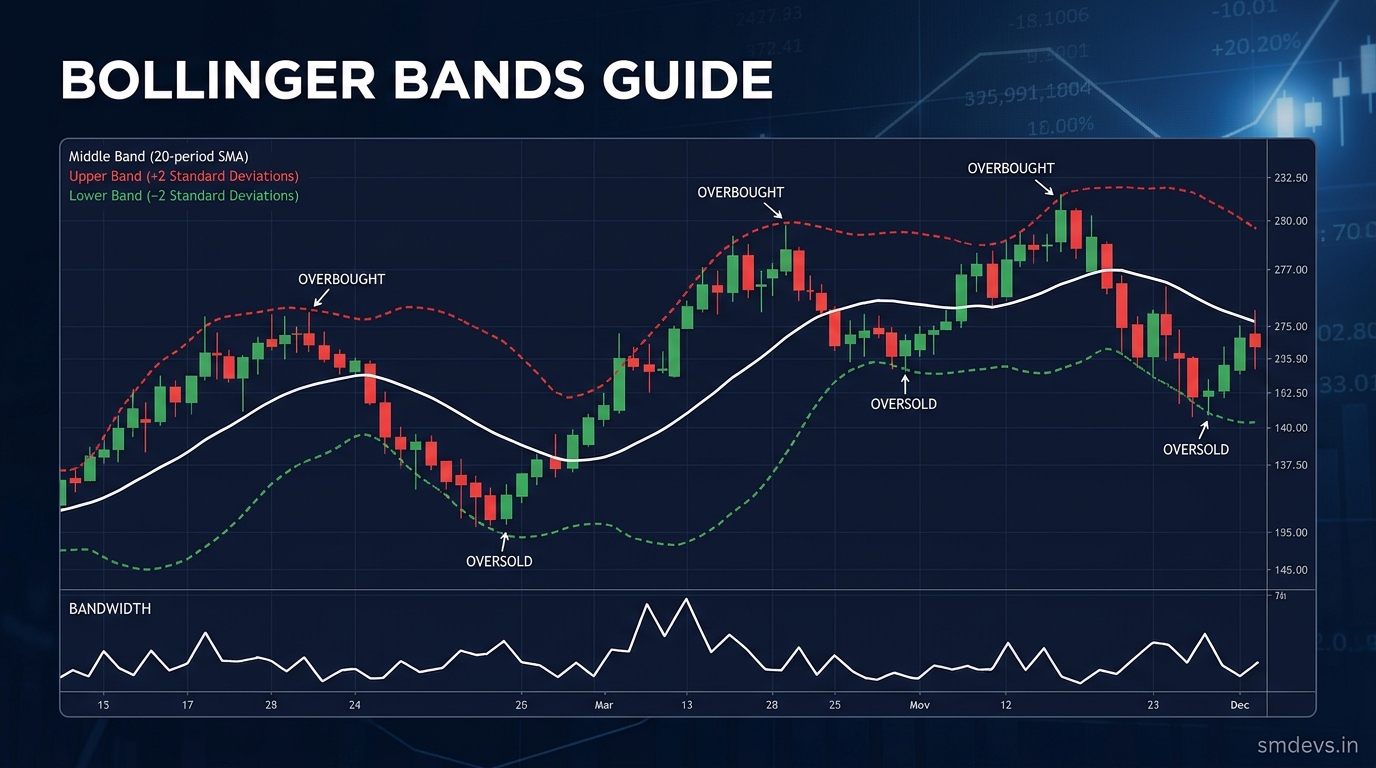
Key Takeaways
- Bollinger Bands are one of the most popular technical indicators used by traders worldwide. This guide explains how they are calculated, how to read band squeeze and expansion, and practical trading strategies.
What are Bollinger Bands?
Bollinger Bands are a volatility indicator created by John Bollinger in the 1980s. They consist of three lines plotted on a price chart:
- Middle Band: A 20-period Simple Moving Average (SMA)
- Upper Band: Middle Band + (2 × Standard Deviation)
- Lower Band: Middle Band − (2 × Standard Deviation)
The bands automatically widen during high volatility and narrow during low volatility — making them dynamic, self-adjusting tools.
How to Calculate Bollinger Bands
Formula:
- Middle Band = 20-period SMA of closing prices
- Upper Band = 20-SMA + (2 × 20-period standard deviation)
- Lower Band = 20-SMA − (2 × 20-period standard deviation)
Statistically, approximately 95% of price action falls within the upper and lower bands.
Reading Bollinger Bands
Band Squeeze (Low Volatility)
When the bands narrow significantly, volatility is low and a big price move is approaching. This is called a "squeeze". Traders watch for the direction of the breakout after a squeeze to determine the trade direction.
Band Expansion (High Volatility)
When the bands widen, volatility is increasing and a strong trend is in place. Price touching the outer bands during expansion indicates strong momentum.
Touching the Upper Band
When price touches or exceeds the upper band, the asset may be overbought in the short term. However, in strong uptrends, price can "walk the band" — staying near the upper band for extended periods.
Touching the Lower Band
When price touches or falls below the lower band, the asset may be oversold. This can signal a potential bounce opportunity in a sideways or uptrending market.
Bollinger Band Trading Strategies
Strategy 1: Mean Reversion (Sideways Markets)
In a ranging market, buy when price touches the lower band and RSI is below 30. Sell when price touches the upper band and RSI is above 70. Target: middle band. Stop loss: below the lower band.
Strategy 2: Bollinger Band Squeeze Breakout
Wait for a squeeze (bands narrow significantly). When price breaks out with high volume, trade in the breakout direction. This can catch the start of a major trend move.
Strategy 3: Trend Following (Walking the Band)
In a strong uptrend, price often "walks" the upper band. As long as price stays above the middle band (20-SMA), hold long positions. A close below the middle band signals trend weakening.
Bollinger Bands + RSI Combination
Bollinger Bands work best combined with RSI:
- Price at lower band + RSI below 30 = Strong buy signal
- Price at upper band + RSI above 70 = Strong sell signal
- Price at lower band but RSI above 50 = Weak signal, skip
Common Bollinger Bands Mistakes
- Treating a touch of the upper band as an automatic sell (doesn't work in strong trends)
- Using Bollinger Bands alone without confirmation
- Not adjusting settings for different timeframes (daily vs hourly)
- Ignoring the squeeze — most traders miss the best setups


