Key Takeaways
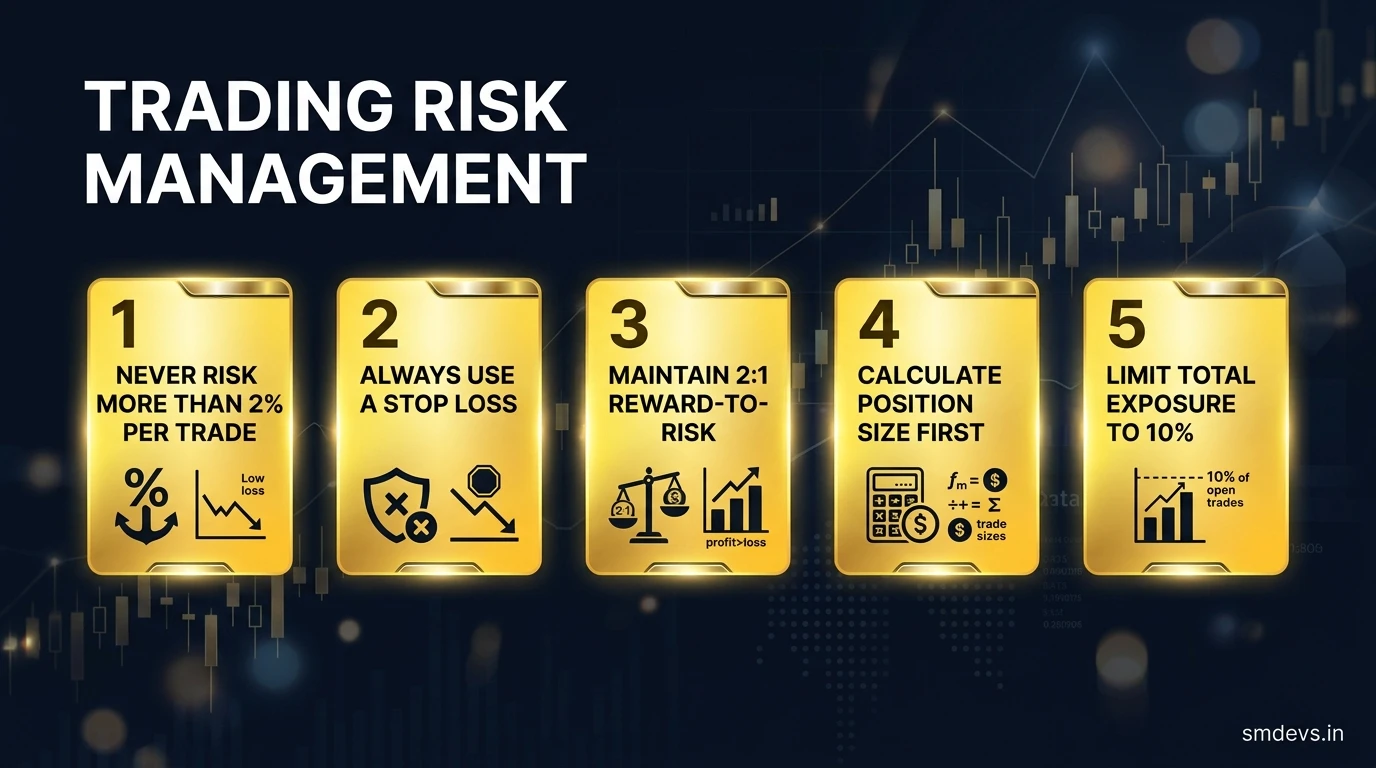
- Never risk more than 2% of your account on any single trade
- Always use a hard stop loss — no exceptions
- Only take trades with at least 2:1 reward-to-risk ratio
- Calculate position size mathematically before every entry
- Limit total portfolio exposure to 10–15% across all open positions
Risk management is the only part of trading that is entirely within your control. Entry signals, chart patterns, and market conditions are all probabilistic — they work some of the time and fail the rest of the time. But how much you risk per trade, how you size your position, and when you cut your losses are decisions that you make, on every trade, regardless of market conditions.
The traders who survive long-term — and eventually thrive — are not the ones with the best entry signals. They are the ones who protect their capital so aggressively that losing streaks cannot wipe them out before their edge has time to play out over hundreds of trades.
This guide covers the 5 golden rules of trading risk management that every active trader must follow.
Why Risk Management Matters More Than Entry Signals
Consider two traders, each making 100 trades with a 50% win rate:
- Trader A risks 2% of their account per trade with a 2:1 reward-to-risk ratio. After 100 trades: +50% return.
- Trader B risks 10% of their account per trade with the same 50% win rate and 2:1 RR. After an inevitable 10-trade losing streak (which happens regularly in trading): account is down 65% — requiring a 186% gain just to recover.
The entry signals were identical. The outcome was completely different. Risk management is not an optional add-on to your trading strategy — it is the strategy.
Key Takeaways
- Never risk more than 2% of your account on a single trade. This is the most important rule in trading and the most frequently violated by beginners.
- Always use a stop loss before you enter any position. Trading without a stop loss is not trading — it is gambling with unlimited downside.
- Only take trades with at least a 2:1 reward-to-risk ratio. With 2:1 RR, you only need to win 34% of your trades to break even.
- Calculate your exact position size before entering every trade. Never size by "feel."
- Limit total portfolio exposure to 10–15% across all open positions. Even with individual 2% risks, five simultaneous losing positions can produce a 10% drawdown — painful but survivable.
Rule 1 — Never Risk More Than 2% Per Trade
The 2% rule is the cornerstone of professional trading risk management. It means that on any single trade, the maximum amount you are willing to lose is 2% of your total trading account value at the time of the trade.
Why 2%? At 2% risk per trade, you can sustain a losing streak of 20 consecutive losing trades and still have 67% of your original capital. Losing streaks of 10–15 trades in a row are mathematically inevitable for any strategy over a large enough sample of trades, even with a 60% win rate. At 2% risk, these streaks are painful but survivable. At 5–10% risk per trade, a 15-trade losing streak becomes a catastrophic loss from which most traders never recover psychologically or financially.
In practice: On a ₹1,00,000 account, your maximum loss per trade is ₹2,000. This is not the amount you invest — it is the maximum amount you are willing to lose if the trade goes against you and hits your stop loss.
Adjust as your account grows: The 2% rule applies to your current account value, not your starting value. As your account grows, your risk per trade in rupees grows, but the percentage stays constant.
Rule 2 — Always Use a Stop Loss
A stop loss is a pre-defined price level at which you will exit a losing trade. It is not a suggestion — it is a non-negotiable requirement for every trade.
Why traders avoid stop losses (and why they are wrong):
- "I'll manually close if it goes against me." — You will not. Losses trigger cognitive biases (hope, denial) that prevent rational decision-making.
- "It will stop out and then reverse." — This happens. It is the cost of disciplined risk management. The alternative — holding a losing position that never reverses — is catastrophic.
- "My analysis is correct and it will come back." — Markets have reversed "incorrect" analysis indefinitely, wiping out accounts that "waited for recovery."
Where to place your stop loss:
- For long trades: below the most recent significant swing low, or below a key support level
- For short trades: above the most recent significant swing high, or above a key resistance level
- Never place stops at round numbers (₹500, ₹1,000) — these are where large orders cluster and stop hunts are common
- Give the stop enough room to account for normal price noise — a stop placed too tightly will be triggered by normal volatility before the trade can develop
Rule 3 — Minimum 2:1 Reward-to-Risk Ratio
The reward-to-risk (RR) ratio compares your potential profit on a trade to the potential loss if the stop loss is hit. A 2:1 RR means you are targeting a profit of ₹4,000 while risking ₹2,000.
Why 2:1 is the minimum: The mathematics of positive expectancy require a meaningful RR ratio. At a 50% win rate and 2:1 RR, your expected value per trade is positive: (0.5 × 2) − (0.5 × 1) = +0.5R per trade. With a 1:1 RR and 50% win rate, your expected value is zero — you make nothing. With sub-1:1 RR, you need a very high win rate just to break even.
How to calculate your RR before entering:
- Entry price: ₹500
- Stop loss: ₹490 (₹10 risk per share)
- Target price: ₹520 (₹20 potential profit per share)
- RR = ₹20 profit ÷ ₹10 risk = 2:1 ✅
If the RR is less than 2:1, don't take the trade. Either find a better entry price, find a more conservative stop placement, or skip the trade entirely. Low RR setups are a primary source of account erosion even for traders with positive win rates.
Rule 4 — Calculate Position Size Before Every Trade
Position sizing is how you translate your risk percentage into an actual number of shares, lots, or units to buy or sell. Many traders set their stop loss and RR correctly but then size their position by feel — leading to inconsistent results and occasional overexposure.
The position sizing formula:
Position Size = (Account Size × Risk %) ÷ Risk Per Share
Worked example:
- Account size: ₹1,00,000
- Risk per trade: 2% = ₹2,000
- Entry price: ₹500
- Stop loss: ₹490
- Risk per share: ₹500 − ₹490 = ₹10
- Position size: ₹2,000 ÷ ₹10 = 200 shares
You buy exactly 200 shares. Not 300 because "it looks strong." Not 100 because "you're not sure." 200 shares — calculated, precise, consistent.
For a complete visual guide to this formula, see the Position Sizing Formula infographic.
Rule 5 — Limit Total Portfolio Exposure to 10–15%
Even if you are risking only 2% per trade, opening multiple positions simultaneously compounds your total portfolio risk. If five positions all go against you at the same time (which happens during market-wide sell-offs), you face a 10% drawdown simultaneously.
Maximum simultaneous position exposure:
- Conservative traders: maximum 3 simultaneous positions = 6% total risk
- Moderate traders: maximum 5 simultaneous positions = 10% total risk
- Active traders: maximum 7 simultaneous positions = 14% total risk — near the 15% ceiling
Additionally, limit correlation risk: If all five of your open positions are in the same sector (e.g., five technology stocks), a sector-specific news event can trigger all five stops simultaneously. Diversify across uncorrelated assets or sectors when running multiple positions.
The Break-Even Rule — Protecting Profits in Running Winners
Once a trade moves at least 1R in your favour (i.e., your profit equals your original risk amount), consider moving your stop loss to break even. This converts the trade into a risk-free position — worst case, you exit at your entry price with no loss.
Moving to break even too quickly can prematurely exit trades with more upside. The standard approach: move to break even once the trade moves 1R in profit, then trail the stop as the trade continues in your favour.
Frequently Asked Questions
Is 2% risk per trade appropriate for all account sizes?
The 2% rule works for most account sizes. For very small accounts (under ₹10,000), 2% per trade may result in position sizes so small that transaction costs eat into returns — in this case, consider 3–5% risk while keeping the absolute amount small. For very large accounts (above ₹50 lakhs), professional traders often reduce risk to 0.5–1% per trade because the absolute amount per trade is already substantial. The percentage is a guideline; adjust for your specific situation while maintaining the core principle of strict capital preservation.
What is a good win rate for a profitable trader?
Many professional traders maintain win rates between 40–55%. This is not a mistake — with a consistent 2:1 or higher RR ratio, a 40% win rate is comfortably profitable. Trying to achieve a very high win rate (70%+) usually means taking very low RR trades or using very tight stops that get hit frequently. Focus on maintaining a good RR ratio first; let your win rate be whatever it naturally is within your system.
Should I use mental stop losses or hard stop orders?
Hard stop orders are strongly preferred over mental stops for almost all retail traders. Mental stops require discipline under pressure — exactly when cognitive biases are strongest. Hard stops execute automatically, removing human emotion from the exit decision. The only common exception is highly liquid intraday traders who can manually manage exits in real-time without emotion clouding their judgment — a skill that takes years to develop.
What happens to position sizing during high-volatility periods?
During high-volatility periods (earnings seasons, macro events, market crises), the risk per share on a given stop-loss distance may be much larger than normal, resulting in very small position sizes from the formula. This is correct — the formula naturally reduces your position size when volatility is high, which is exactly the right response. Never override the formula by using a tighter stop to create a larger position size during volatile conditions. High volatility means smaller positions, not larger ones.
Your Next Step
Download the 5 Golden Rules of Trading Risk Management infographic for a desk reference. For the complete position sizing calculation with a worked example, see the Position Sizing Formula infographic. And to build the chart reading skills that identify the best entry points for your risk-managed trades, explore the full chart pattern infographic library.


