Key Takeaways
- Pivot points are key support and resistance levels calculated from the previous day's high, low, and close prices.
- The standard pivot point formula: PP = (High + Low + Close) ÷ 3.
- Pivot points are most popular among intraday traders for planning entries, exits, and stop losses.
- There are 5 types of pivot point systems: Standard, Fibonacci, Camarilla, Woodie's, and DeMark's.
- SM Developers' free pivot calculator instantly generates all S1, S2, S3, R1, R2, R3 levels.
In the world of intraday trading, the difference between a profitable day and a losing one often comes down to one thing: knowing your key price levels before the market opens. This is exactly what pivot points give you.
Used by professional floor traders for decades before being adopted by retail traders worldwide, pivot points are a mathematically derived set of support and resistance levels that act as a roadmap for the trading day. In this complete guide, we'll break down everything you need to know — and show you how to use our free pivot calculator to plan your trades like a pro.
What Are Pivot Points?
Pivot points are horizontal price levels calculated from the previous trading session's High, Low, and Close prices. They predict likely support and resistance zones for the upcoming session and are extremely popular in:
- Intraday (day) trading
- Futures and options trading
- Forex trading
- Commodity trading (crude oil, gold, silver)
The central pivot point (PP) is the most important level. Price trading above PP suggests bullish bias for the day; price trading below PP suggests bearish bias.
The Standard Pivot Point Formula
The classic pivot point calculation requires just three inputs from the previous day's session:
- H = Previous Day's High
- L = Previous Day's Low
- C = Previous Day's Close
The formulas are:
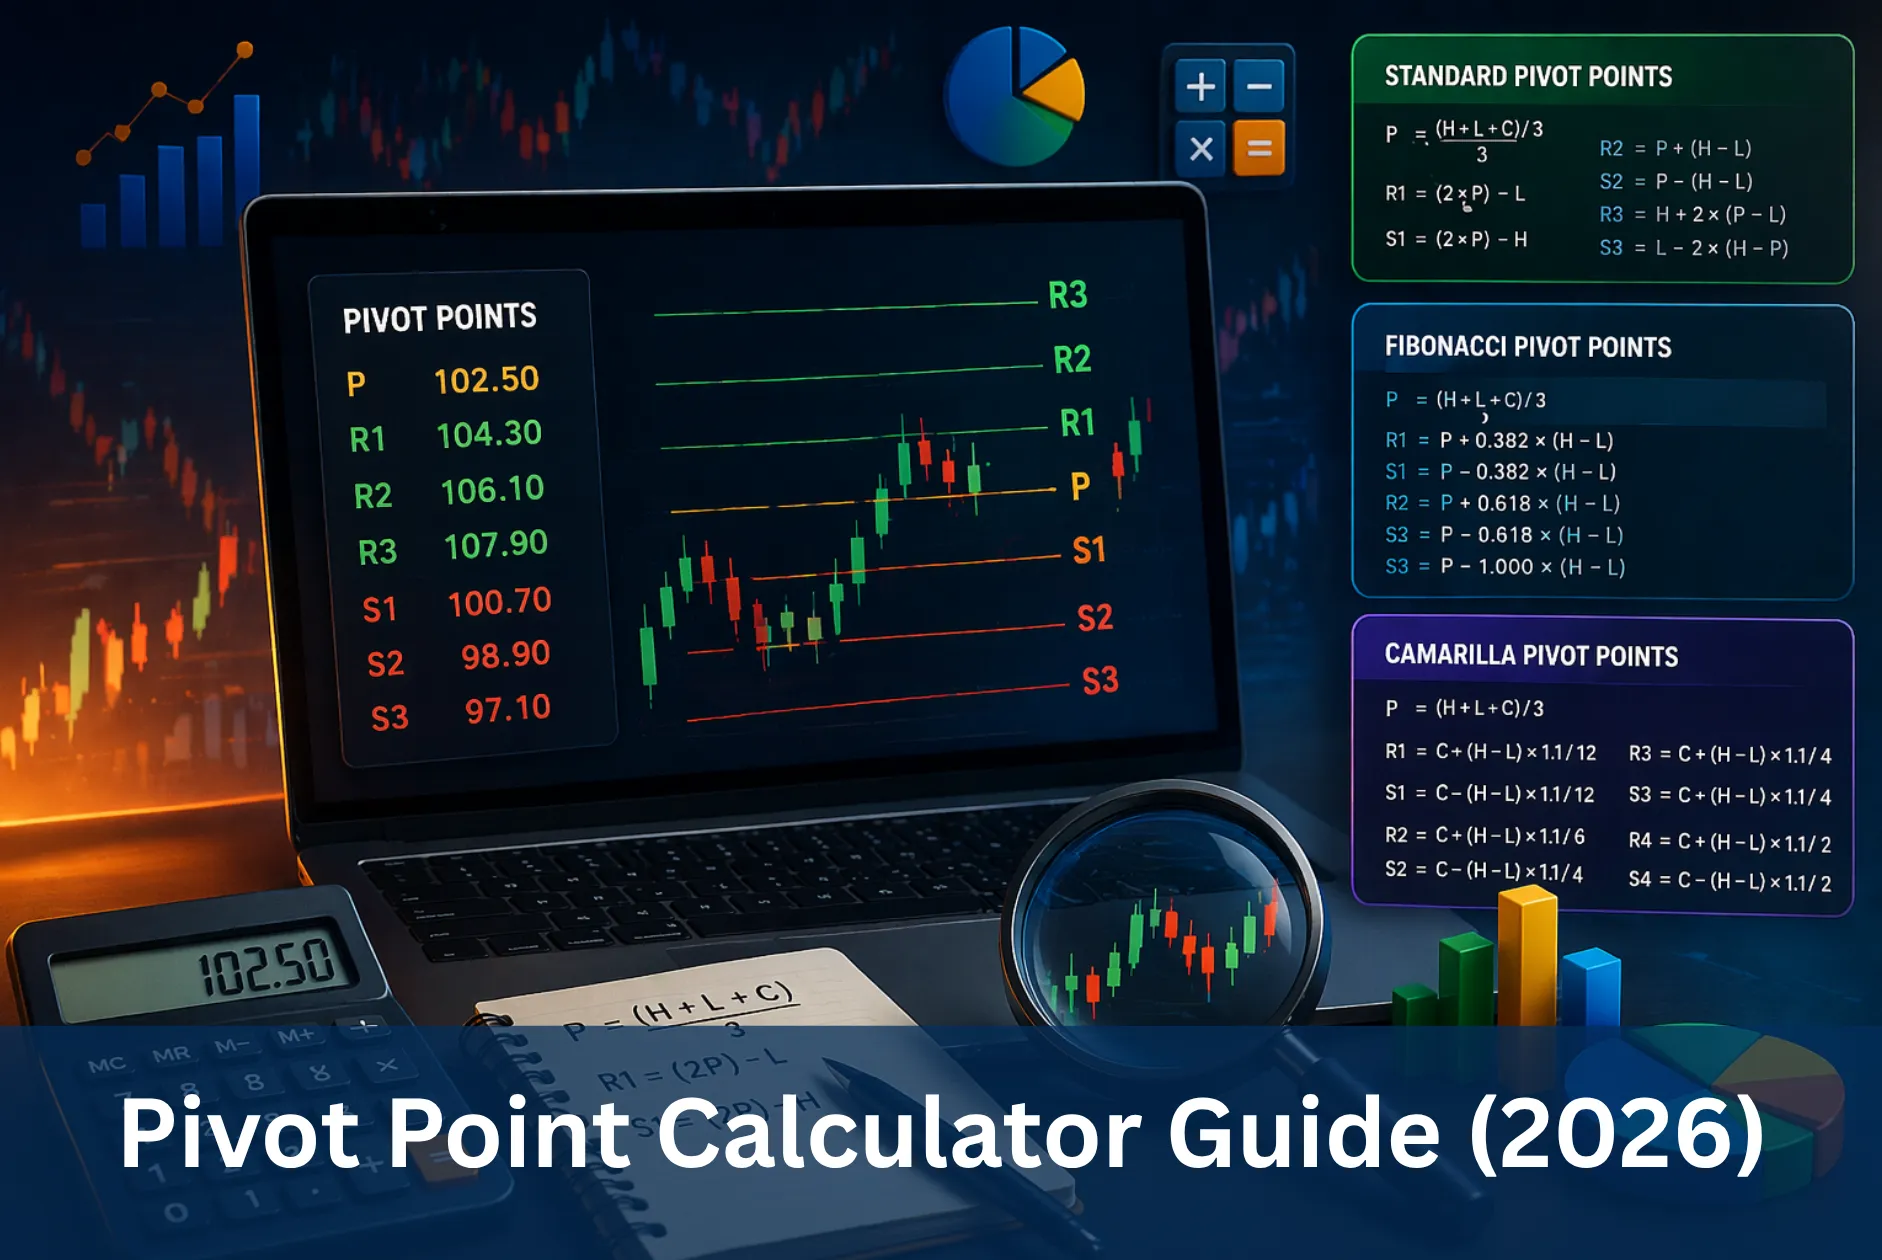
- Pivot Point (PP) = (H + L + C) ÷ 3
- Resistance 1 (R1) = (2 × PP) − L
- Support 1 (S1) = (2 × PP) − H
- Resistance 2 (R2) = PP + (H − L)
- Support 2 (S2) = PP − (H − L)
- Resistance 3 (R3) = H + 2(PP − L)
- Support 3 (S3) = L − 2(H − PP)
Example Calculation
Let's say Nifty 50 had the following data yesterday:
- High: 24,500
- Low: 24,100
- Close: 24,350
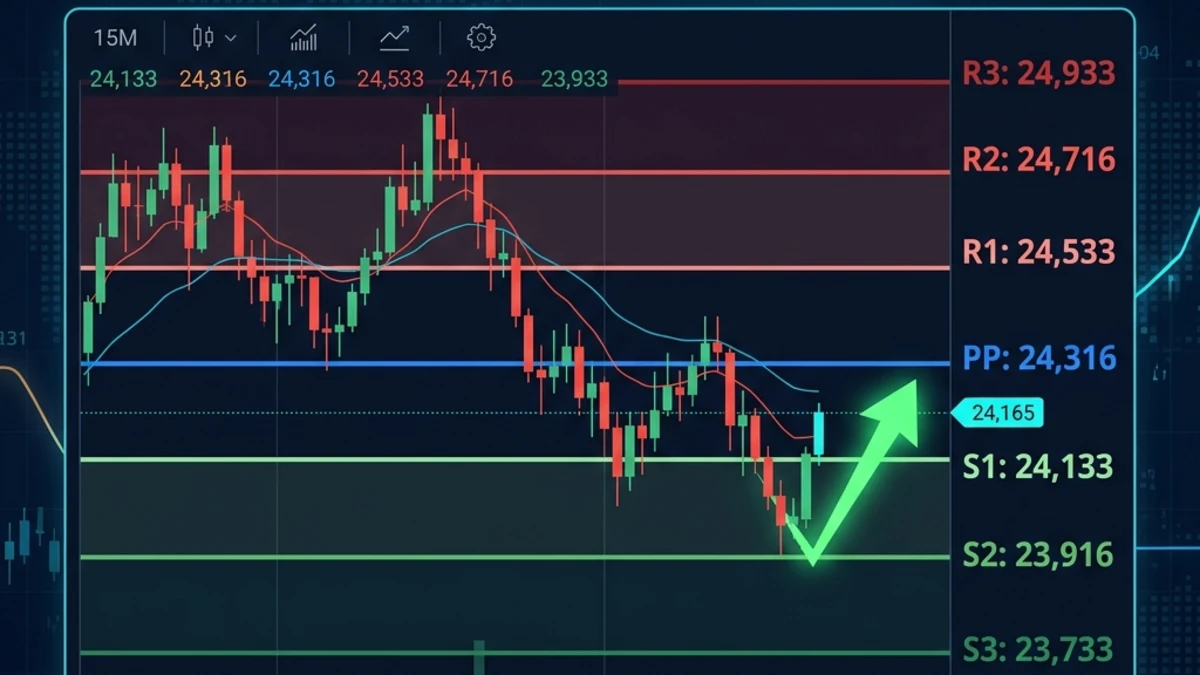
PP = (24,500 + 24,100 + 24,350) ÷ 3 = 24,316.67
R1 = (2 × 24,316.67) − 24,100 = 24,533.34
S1 = (2 × 24,316.67) − 24,500 = 24,133.34
R2 = 24,316.67 + (24,500 − 24,100) = 24,716.67
S2 = 24,316.67 − (24,500 − 24,100) = 23,916.67
These are the key levels to watch tomorrow. Rather than computing this manually every day, use our free pivot point calculator to get all levels instantly.
5 Types of Pivot Point Systems
1. Standard (Classic) Pivot Points
The most widely used system, as calculated above. Excellent baseline for all markets.
2. Fibonacci Pivot Points
Uses Fibonacci retracement levels (38.2%, 61.8%, 100%) instead of simple arithmetic to calculate support and resistance. Popular among traders who combine Fibonacci analysis with price action.
3. Camarilla Pivot Points
Uses a multiplier (1/1.1) to generate 8 levels (L1–L4, H1–H4). Particularly effective for mean-reversion intraday strategies. If price opens within H3–L3, traders look for reversals; if it breaks H4 or L4, they trade the breakout.
4. Woodie's Pivot Points
Gives extra weight to the closing price: PP = (H + L + 2C) ÷ 4. Preferred by traders who believe the close is the most significant price of the day.
5. DeMark's Pivot Points
The formula changes based on the relationship between open and close. Most complex but theoretically most sensitive to market momentum.
How to Trade Using Pivot Points: 3 Core Strategies
Strategy 1: Pivot Point Bounce (Reversal)
When price approaches a support level (S1, S2) from above and shows reversal signals (bullish candlestick patterns, volume spike), enter a long trade targeting the pivot point or the next resistance level.
Strategy 2: Pivot Point Breakout
When price breaks cleanly through a resistance level (R1) with strong volume and closes above it, enter a long trade targeting R2. Set stop loss below R1.
Strategy 3: Pivot as Directional Bias
Use the central pivot point as a market sentiment indicator:
- Price consistently above PP all day → Bullish day, look for long setups only
- Price consistently below PP all day → Bearish day, look for short setups only
Using Our Free Pivot Point Calculator
Our pivot calculator at SM Developers makes daily pivot planning effortless:
- Visit smdevs.in/tools/trading/pivot-calculator
- Enter the previous session's High, Low, and Close
- Select your preferred pivot type (Standard, Fibonacci, Camarilla, Woodie's)
- Click "Calculate"
- All support and resistance levels are displayed instantly
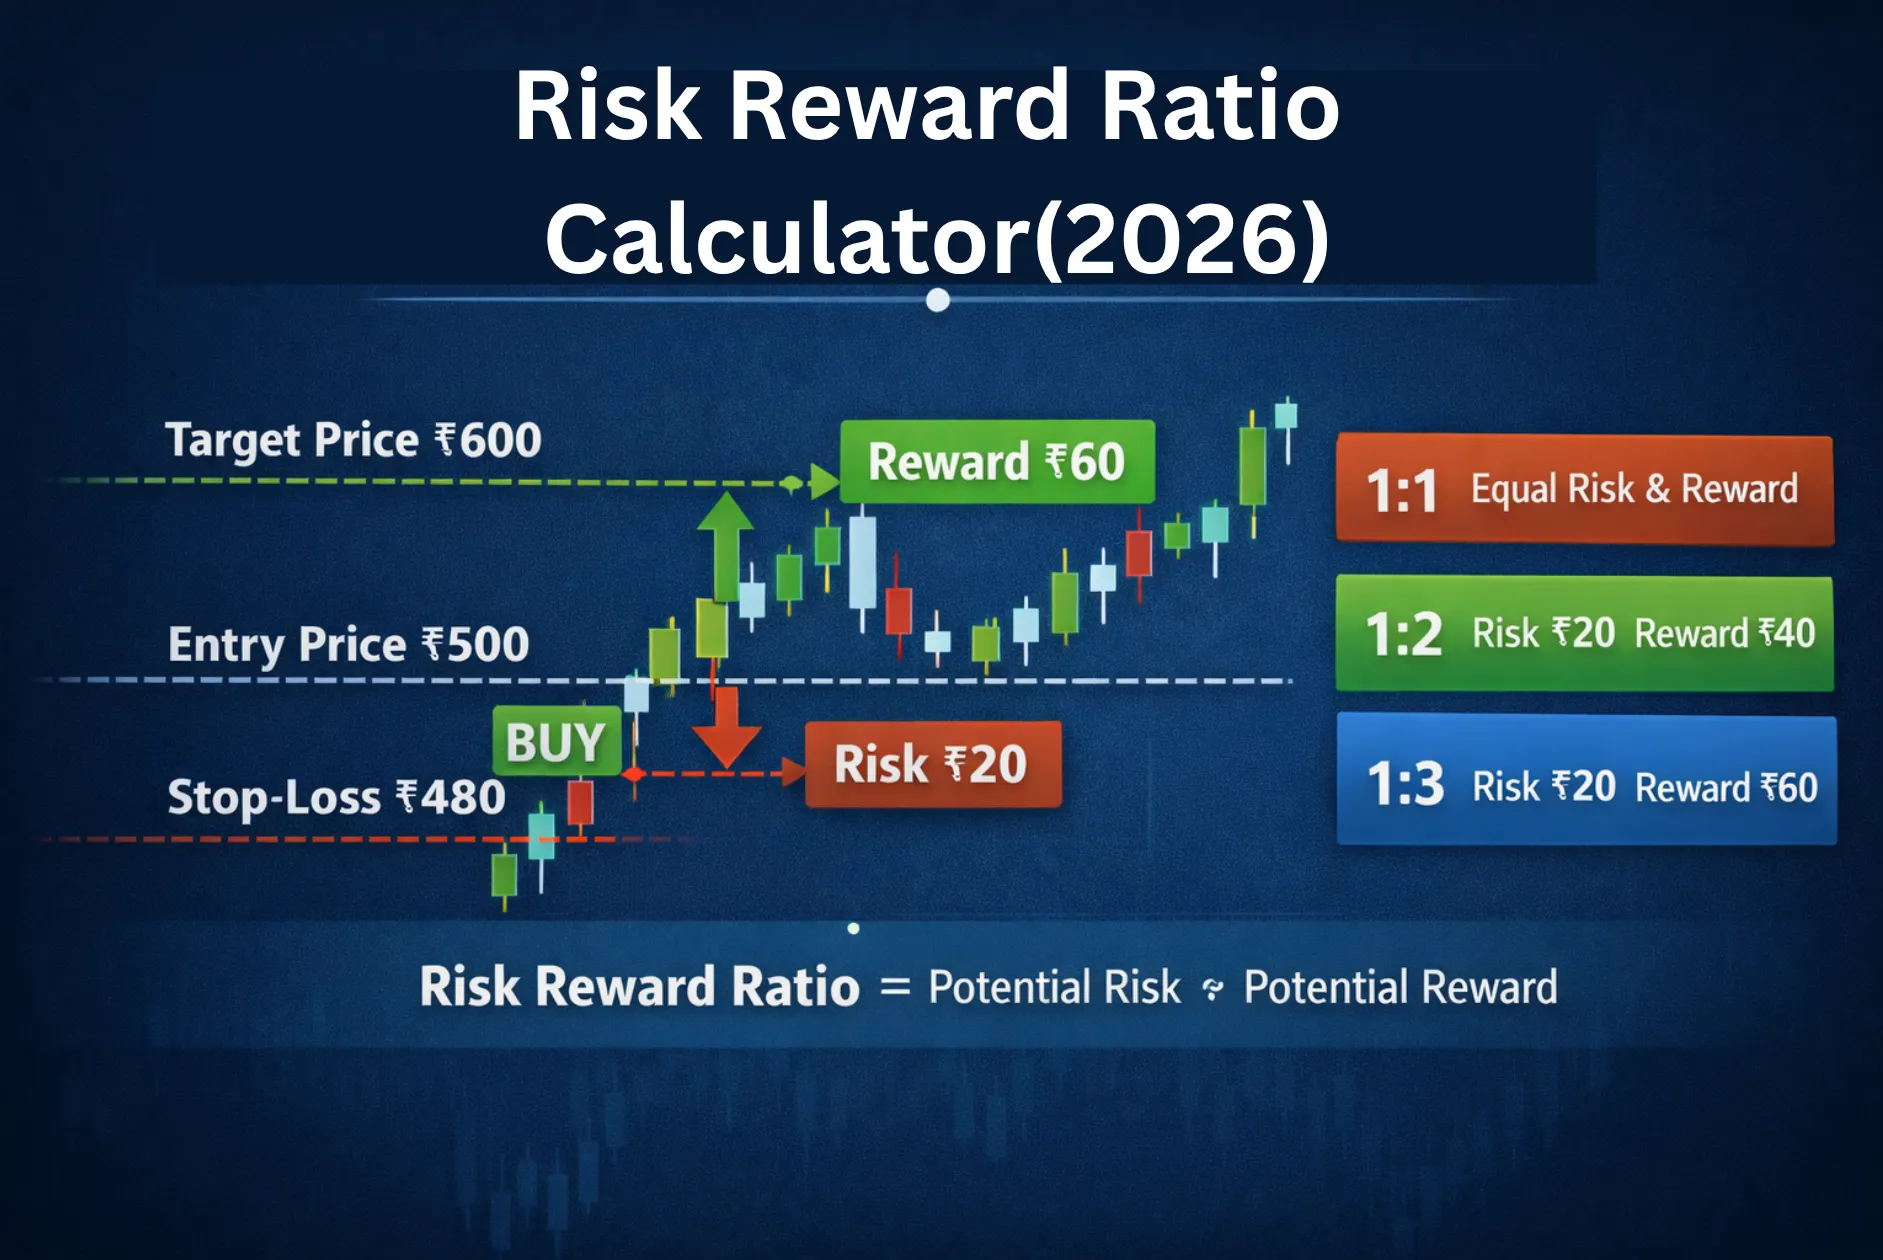
Combine pivot levels with our Risk-Reward Calculator to plan complete trade setups with defined entry, stop loss, and target levels.
Frequently Asked Questions
Are pivot points effective for Indian stock market intraday trading?
Yes! Pivot points are widely used by Indian intraday traders for Nifty 50, Bank Nifty, and individual stocks. They work particularly well in trending markets and during high-volume sessions like market open (9:15–10:00 AM) and close (2:30–3:30 PM).
Which pivot point type is best for beginners?
Standard (Classic) pivot points are the best starting point for beginners. They're simple to understand, widely referenced by institutional traders (creating self-fulfilling significance), and provide clear S1, S2, R1, R2 levels that are easy to act upon.
Should I use daily or weekly pivot points for intraday trading?
Daily pivot points (calculated from the previous day's OHLC data) are most appropriate for intraday traders. Weekly pivots are more useful for swing traders. For enhanced confluence, some advanced traders overlay both daily and weekly pivot levels on their charts.
Do pivot points work in cryptocurrency trading?
Yes, pivot points can be applied to cryptocurrency markets, but with some adjustments. Since crypto markets trade 24/7, you'll need to define your "day" consistently — most crypto traders use UTC midnight to midnight as their daily session boundary for pivot calculations.
Conclusion: Plan Your Trading Day with Precision
Pivot points give intraday traders an objective, mathematically-derived framework for their trading day. Instead of trading reactively, you trade proactively — knowing your key levels in advance and waiting for price to come to you.
The best part? Calculating them takes under 30 seconds with our free tool.