Key Takeaways
- Breakout trading is one of the most popular and powerful trading strategies. This complete guide explains how to identify breakout setups, confirm with volume, set entries and stop-losses, and filter out false breakouts that trap most traders.
What is Breakout Trading?
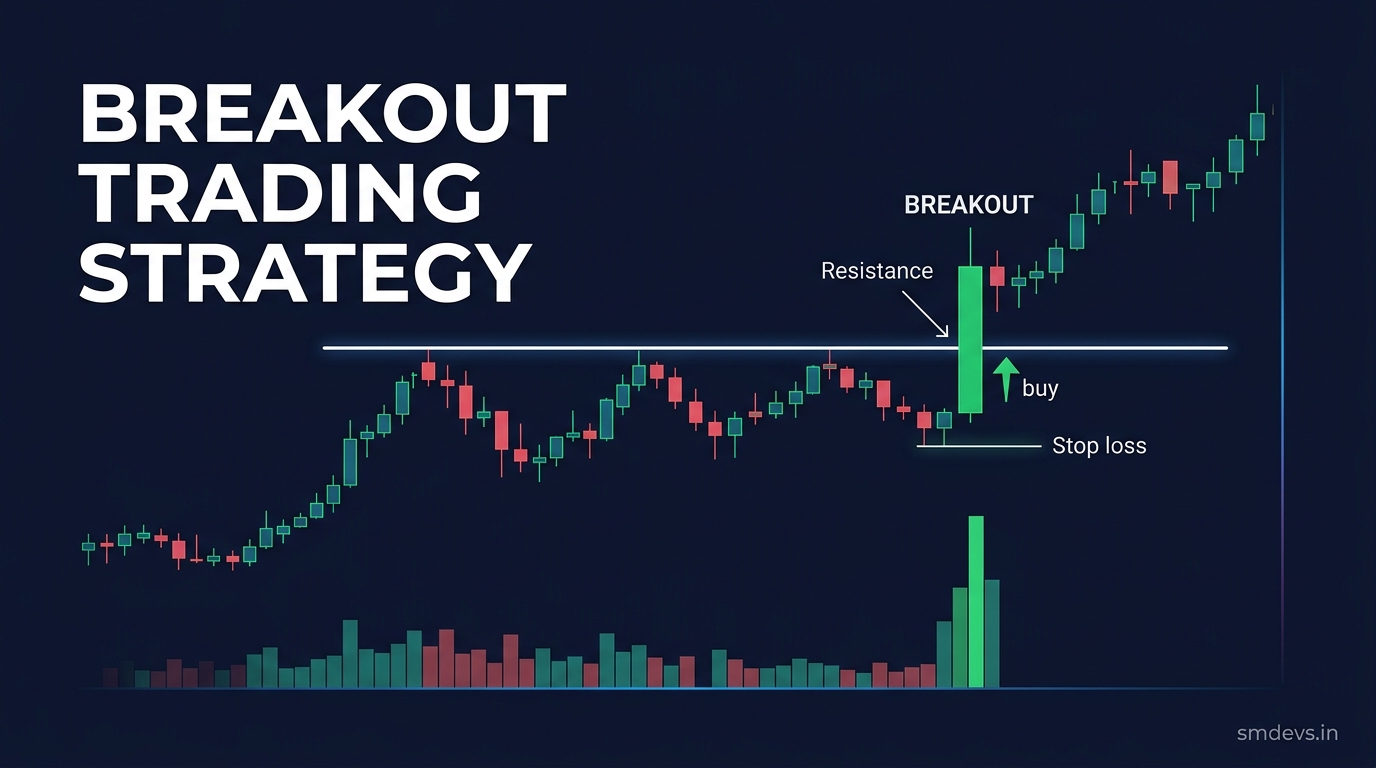
A breakout occurs when price moves above a key resistance level or below a key support level with increased volume, signalling the potential start of a new significant price move in that direction. Breakout traders aim to enter at the start of these major moves.
Why Breakouts Work
Resistance and support levels accumulate a large number of pending orders. When price breaks through, stop-losses are triggered, new buyers rush in (for bullish breakouts), and algorithmic trading systems automatically enter — creating a cascade of buying or selling pressure that drives the price significantly in the breakout direction.
Types of Breakout Patterns
1. Horizontal Breakout
Price consolidates between a flat resistance and flat support (rectangle pattern). A breakout above resistance or below support initiates the trade. Target: height of the rectangle projected in the breakout direction.
2. Triangle Breakout
- Ascending triangle: Flat resistance, rising support → bullish breakout expected
- Descending triangle: Falling resistance, flat support → bearish breakdown expected
- Symmetrical triangle: Converging lines → breakout in either direction, trade the actual break
3. Trendline Breakout
Price breaks above a downtrend line (potential trend reversal) or below an uptrend line (potential trend reversal). More subjective — requires strong volume confirmation.
4. 52-Week High Breakout
When a stock breaks above its 52-week high with high volume, it's in completely uncharted territory — no overhead resistance. This is a powerful momentum setup used by many professional traders.
How to Trade a Breakout: Step by Step
- Identify the resistance/support level: It should have been tested at least 2–3 times
- Wait for the breakout candle: A candle that closes above resistance (not just pokes through)
- Confirm with volume: Volume should be at least 1.5× the 20-day average
- Enter on the breakout close or on the retest of the broken resistance as new support
- Set stop-loss: Just below the breakout level (or previous candle's low)
- Set target: Measured move from the pattern (e.g., height of the consolidation box)
How to Avoid False Breakouts
False breakouts (price briefly breaks level then reverses) are the biggest challenge:
- Volume requirement: Never enter a breakout on low volume
- Wait for close: Never enter on an intraday break — wait for candle close
- Check context: Is the overall market/index in a breakout mood? Avoid buying breakouts in a downtrending broader market
- Wait for retest: More conservative traders wait for price to break, pull back to the level, and bounce — confirming the level as new support
Breakout Trading Risk Management
- Risk 1–2% of capital per trade
- Stop-loss must be set before entry
- Minimum Risk:Reward ratio of 1:2
- Accept that false breakouts happen — cut losses quickly
- Never average down on a failed breakout


