MACD Indicator — 4 Trading Signals You Must Know
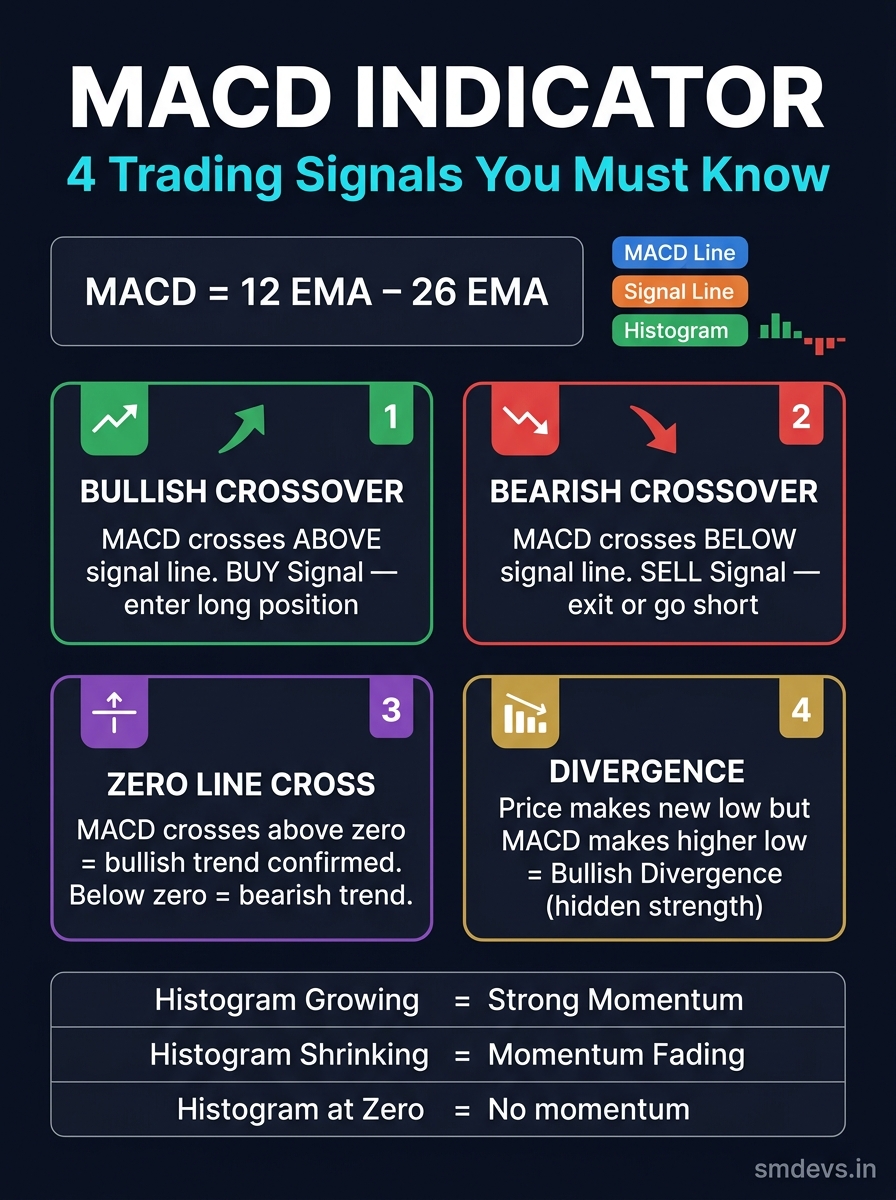
All 4 MACD signals explained: bullish crossover, bearish crossover, zero-line cross, and divergence — with the histogram quick-reference table.
Click to open full-screen view · Free to share with attribution
About This Infographic
The MACD (Moving Average Convergence Divergence) is built from three components: the MACD Line (12 EMA − 26 EMA), the Signal Line (9-period EMA of MACD), and the Histogram (MACD minus Signal Line). This infographic breaks down all 4 actionable trading signals in one clean reference. Signal 1 — Bullish Crossover: MACD Line crosses above the Signal Line, indicating rising momentum and a potential buy entry. Signal 2 — Bearish Crossover: MACD Line crosses below the Signal Line, signaling weakening momentum and a potential exit or short entry. Signal 3 — Zero Line Cross: When MACD crosses above zero, the 12 EMA has crossed above the 26 EMA — trend is now officially bullish; crossing below zero confirms a bearish trend. Signal 4 — Divergence (most powerful): Bullish Divergence occurs when price makes a lower low but MACD makes a higher low, revealing hidden buying pressure before a reversal. The bottom quick-reference table maps histogram behaviour to momentum strength: growing histogram = strong momentum; shrinking histogram = fading momentum; histogram at zero = no directional momentum.
Related Infographics
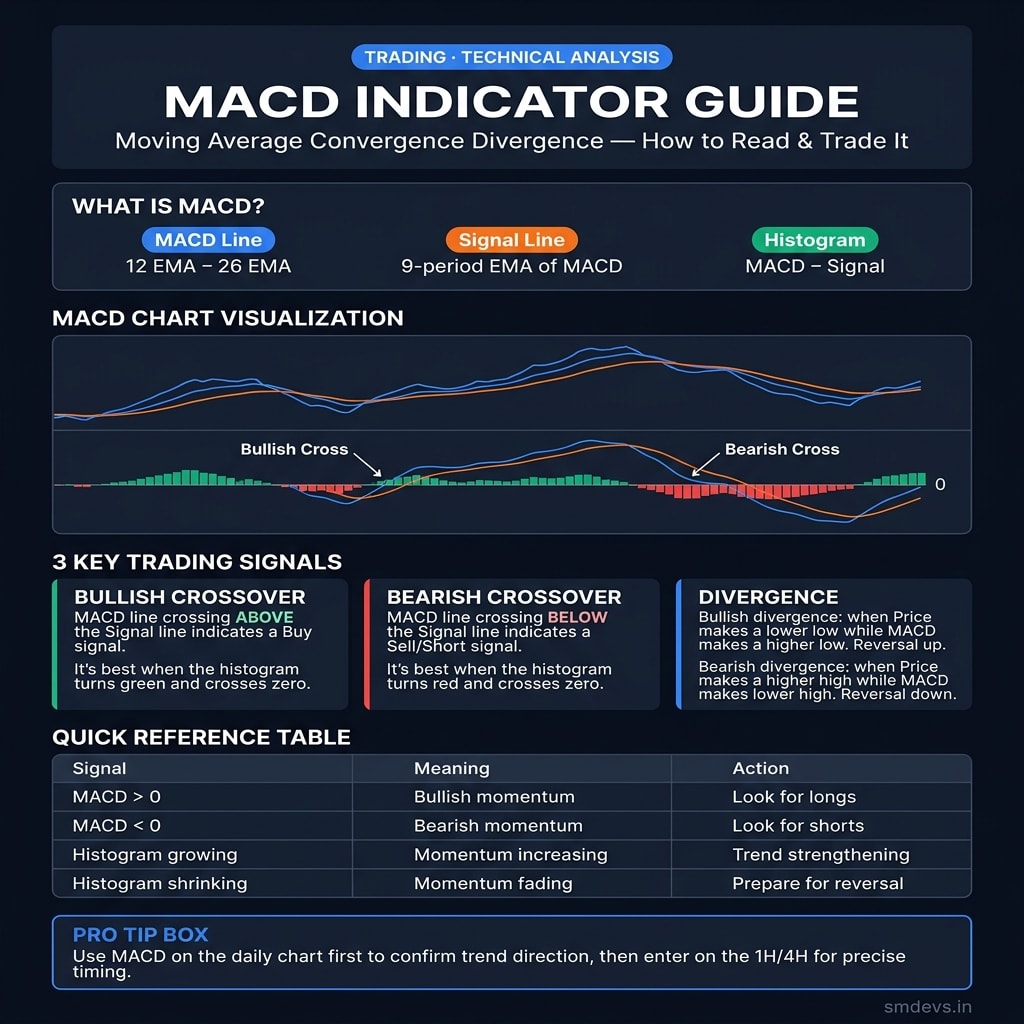
MACD Indicator Guide — Crossovers, Histogram & Divergence Explained
How to read the MACD indicator, identify bullish and bearish crossovers, read histogram momentum, and spot divergence signals for high-probability trades.
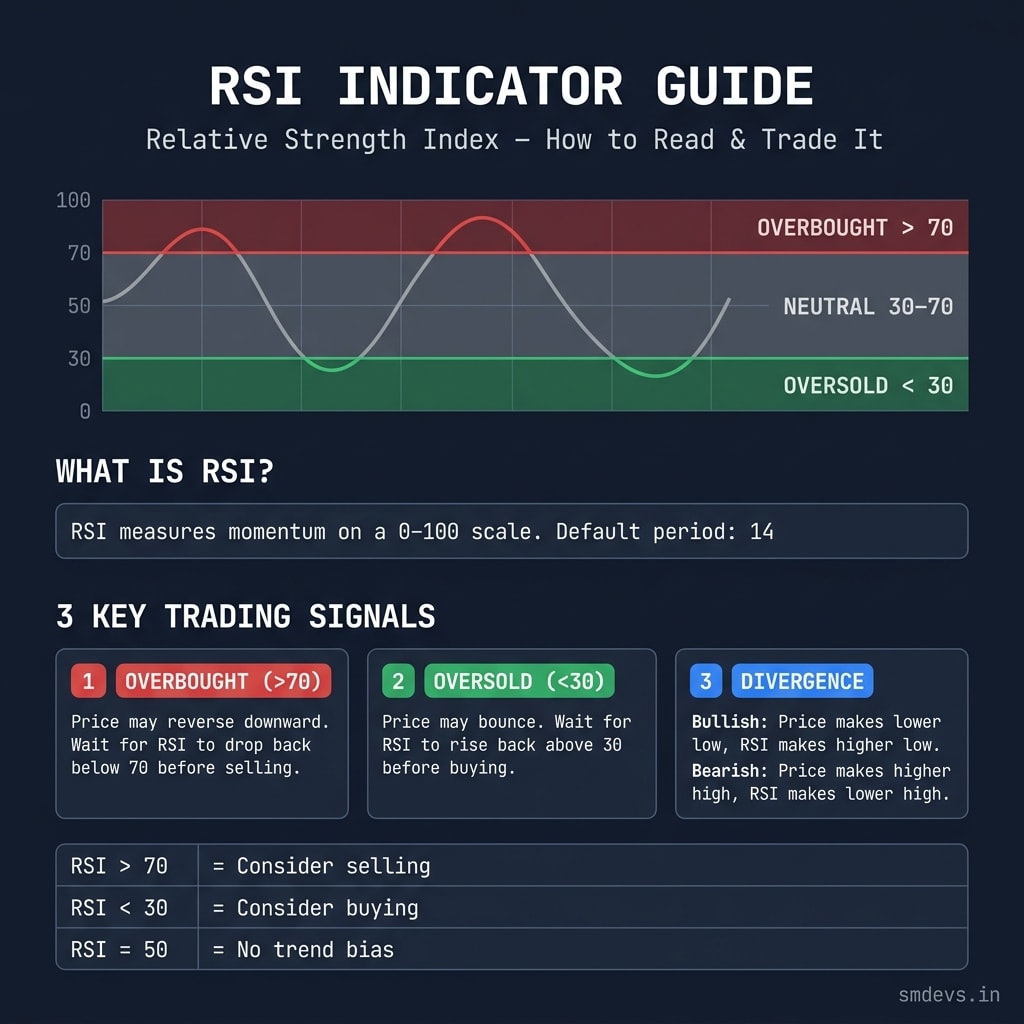
RSI Indicator Guide — Overbought, Oversold & Divergence Explained
How to read the RSI indicator, identify overbought and oversold zones, spot bullish and bearish divergence, and trade all three signals correctly.
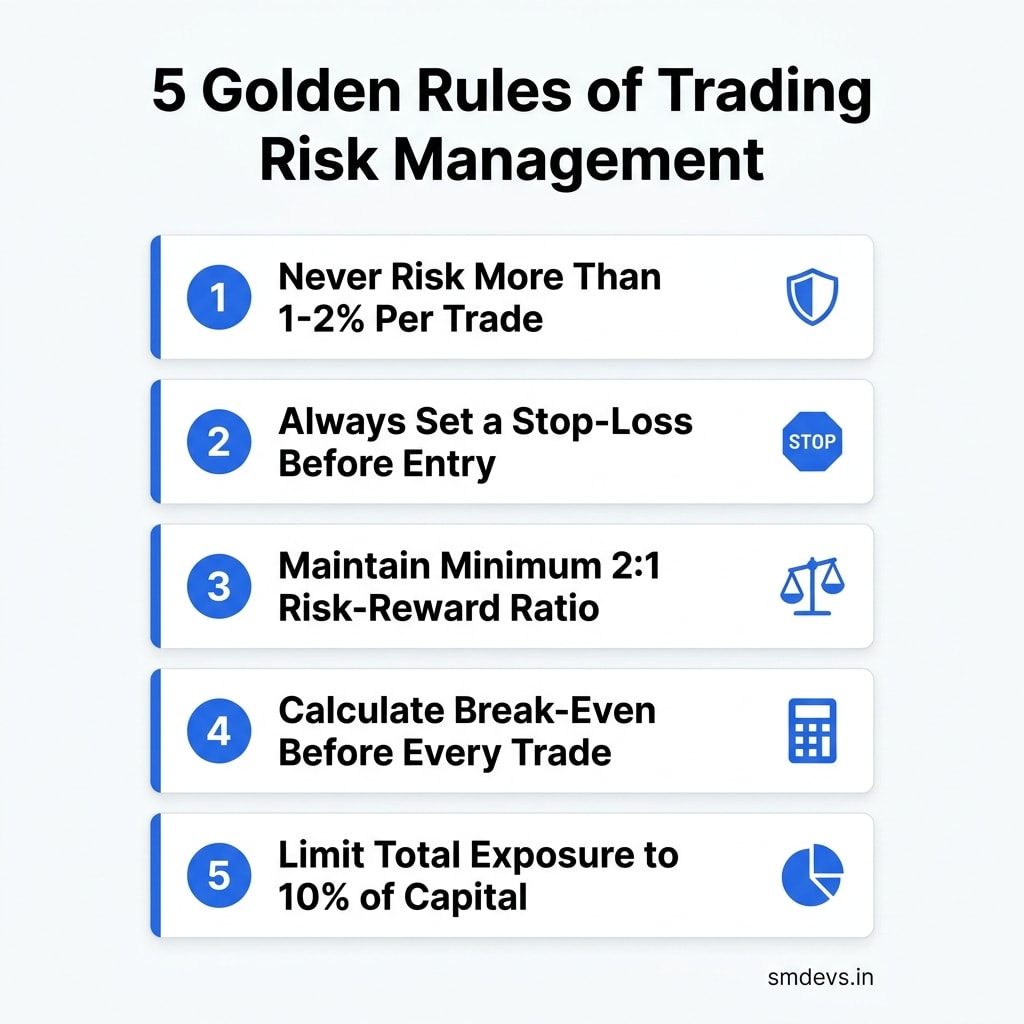
5 Golden Rules of Trading Risk Management
The 5 non-negotiable rules every trader must follow to protect capital and stay in the game long-term.
Need Help Growing Your Website?
Use our free SEO tools to audit and optimize your site — no signup required.