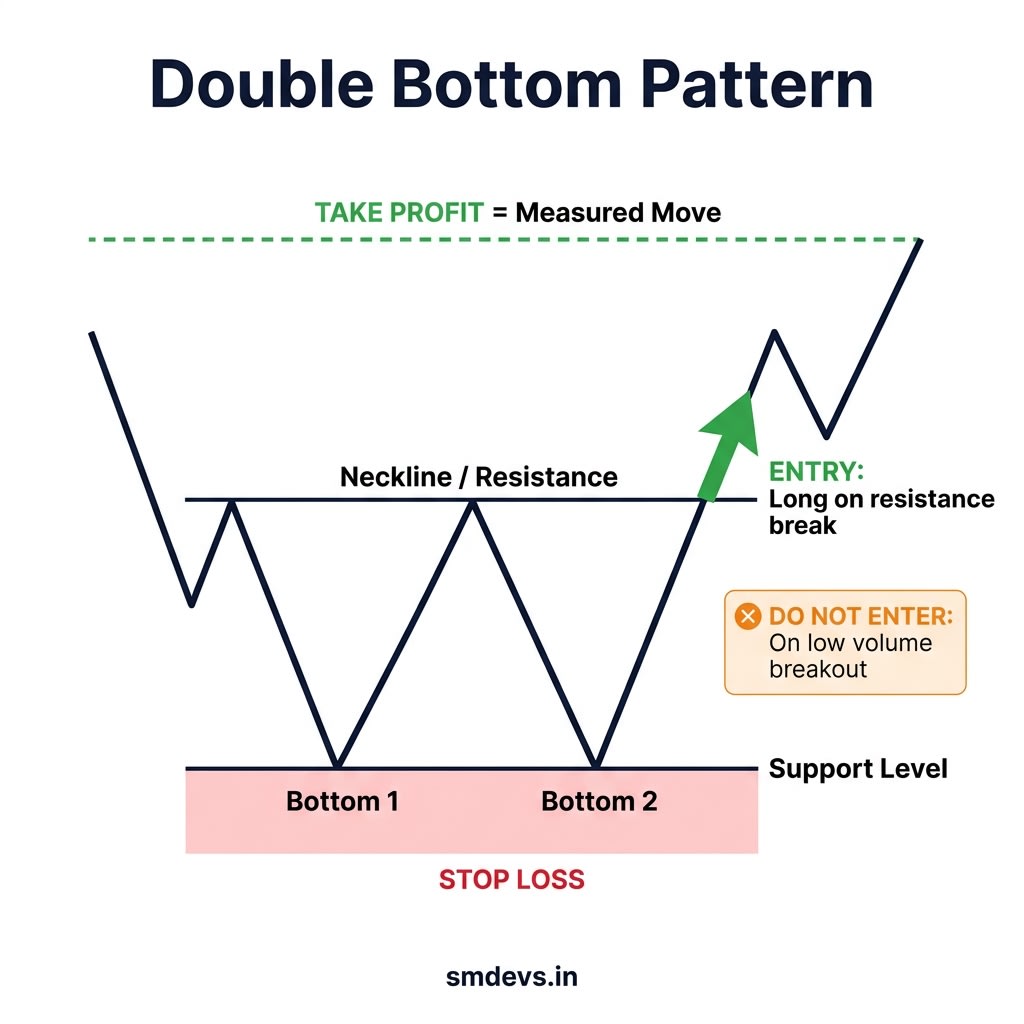
Double Bottom Pattern — Entry, Exit & Stop Loss Guide
How to spot a valid Double Bottom (W pattern), when to enter long on the breakout, where to set your stop, and when not to trade it.
Click to open full-screen view · Free to share with attribution
About This Infographic
The Double Bottom (W pattern) is a powerful bullish reversal setup that forms when price tests the same support level twice and holds both times. This infographic illustrates the two troughs at support, the neckline resistance between them, the confirmed entry trigger (close above neckline with volume), stop loss placement below both bottoms, measured move target calculation, and the most common trap — entering before the neckline breaks and getting caught in a failed reversal.
Related Infographics
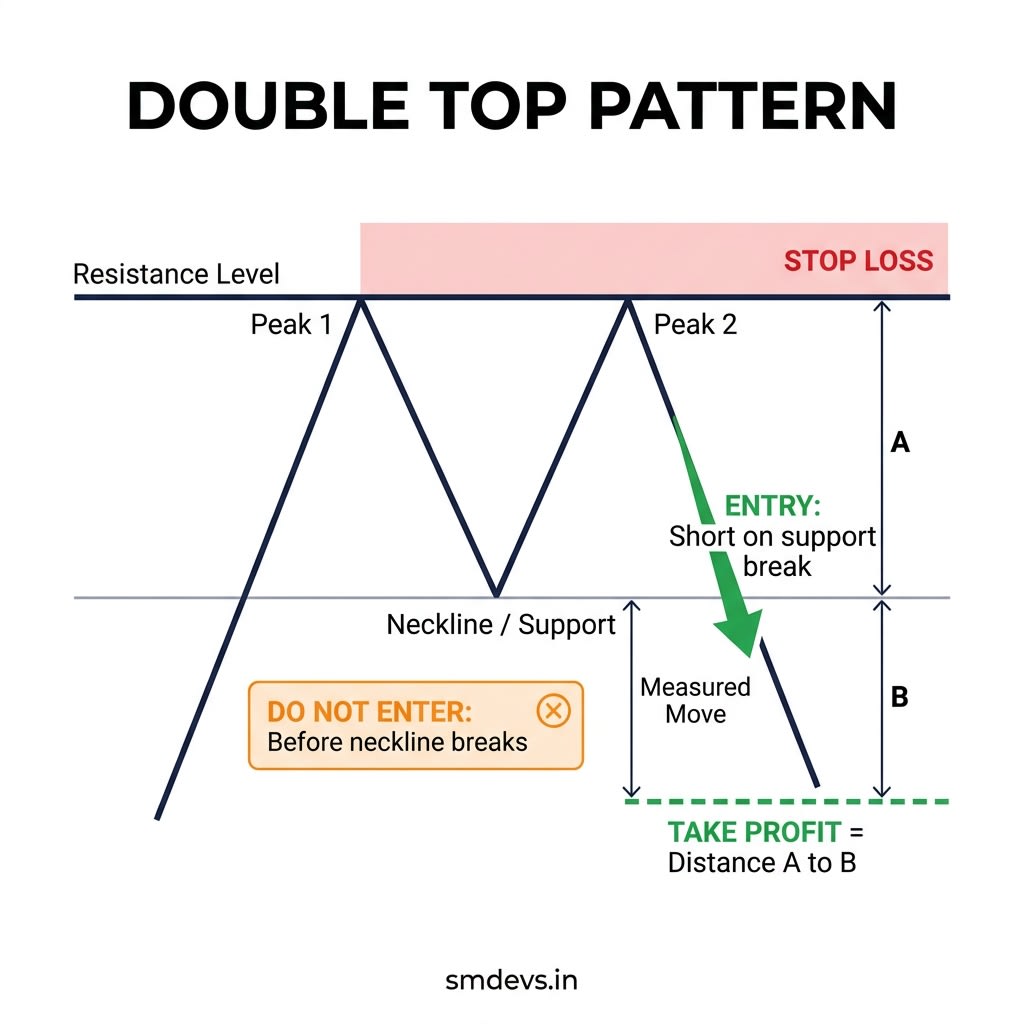
Double Top Pattern — Entry, Exit & Stop Loss Guide
How to identify a valid Double Top, when to enter short after neckline breaks, where to set your stop, and when to stay out.
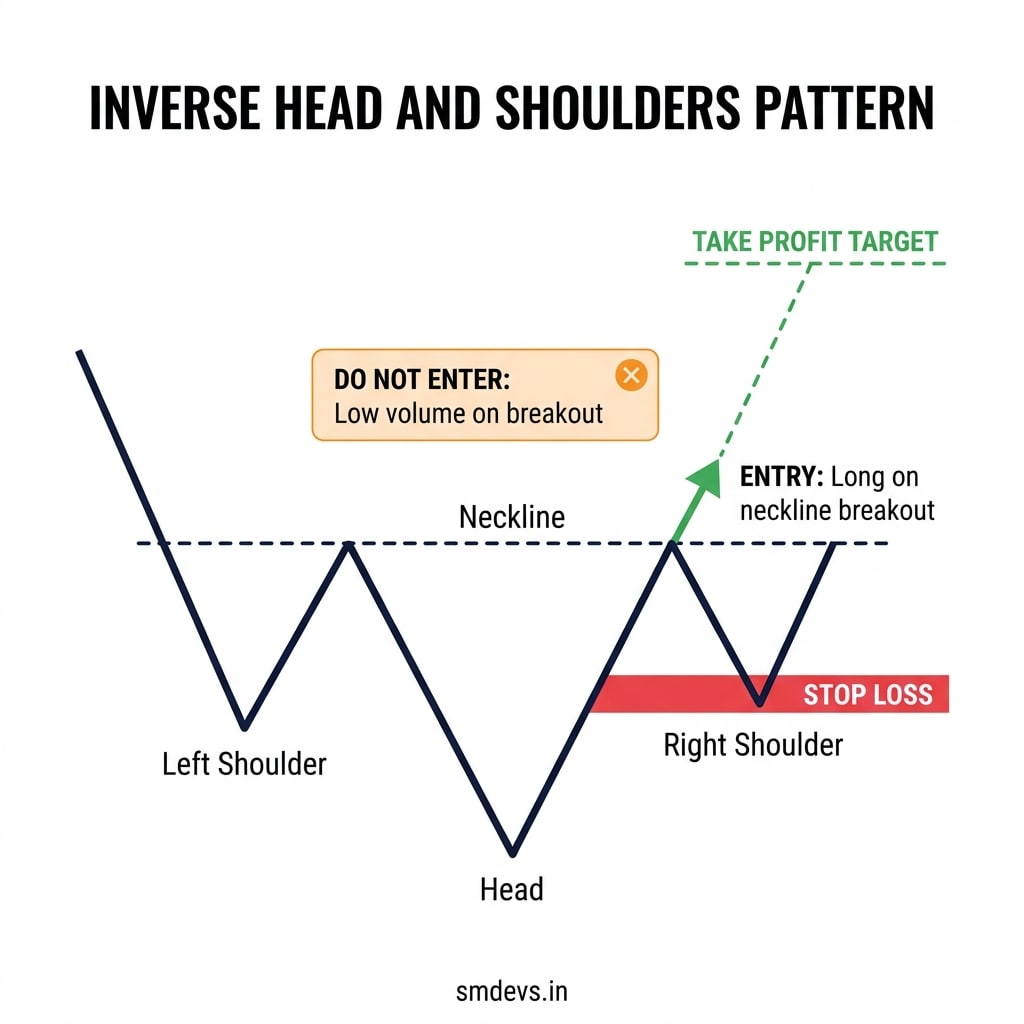
Inverse Head and Shoulders Pattern — Entry, Exit & Stop Loss Guide
How to identify the Inverse Head and Shoulders bullish reversal, where to enter long, set your stop loss, and when to skip the trade.
Need Help Growing Your Website?
Use our free SEO tools to audit and optimize your site — no signup required.